
AMELH5050S-R56MT Datasheet Deep Dive: Specs & Graphs
Key Takeaways (GEO Summary)
- High Efficiency: 1.1mΩ DCR reduces I²R losses by ~15% vs standard 2mΩ inductors.
- Space Saving: 5x5mm footprint reduces PCB area by 20% compared to typical 6x6mm alternatives.
- Robust Power: 28A saturation current supports high-surge PoL converter transients without failure.
- Thermal Stability: Soft-saturation design prevents abrupt inductance drops, ensuring stable 20A continuous operation.
The AMELH5050S-R56MT is presented in the official datasheet as a compact, high-current SMD power inductor with nominal inductance 0.56 μH, milliohm-range DCR, and a 5.0×5.0 mm package optimized for point-of-load converters. This article decodes the datasheet, explains key graphs, quantifies real-world performance, and gives clear selection and test guidance engineers can apply directly to converter designs. The goal is practical, data-driven interpretation rather than a simple spec repeat.
The datasheet emphasizes low loss, high current capability, and soft-saturation behavior that benefit efficiency and transient response in synchronous buck and LED driver topologies. Readers will find worked examples for ripple calculation, copper-loss estimates, thermal rise approximations, bench-test recommendations, and PCB/layout guidance so the part can be validated quickly on prototype hardware against the stated performance envelope.
1 — Quick Product Overview & Key Specs
Performance Comparison: AMELH5050S vs. Industry Standards
| Parameter | AMELH5050S-R56MT | Generic 5050 Inductor | Advantage |
|---|---|---|---|
| Typical DCR | 1.1 mΩ | 1.8 - 2.5 mΩ | ~40% Lower Loss |
| Saturation (Isat) | 28 A | 22 A | Higher Surge Headroom |
| Saturation Style | Soft | Hard/Standard | Better Loop Stability |
| Temp. Range | -40 to +125°C | -40 to +105°C | Industrial Grade Reliability |
What the datasheet emphasizes and why it matters
The official datasheet calls out low DCR and high current capacity because these directly lower I²R losses and temperature rise in high-current converters. For designers, the headline numbers affecting efficiency are DCR and L under DC bias, while thermal and EMI behavior tie to Irms and shielded construction. Prioritize those metrics when sizing the inductor for a given converter operating point.
2 — Electrical Performance: Inductance, DCR & Frequency Behavior
Inductance vs current (L(I)) and saturation metrics
The L(I) curve shows inductance falling as DC bias increases; datasheet Isat is often defined at the current where L has dropped by 30%. For example, if 0.56 μH falls to ~0.35 μH at 20–25 A bias, that change raises ripple current. For a buck switching node with Vsw = 12 V step and fsw = 500 kHz, ΔI = Vsw/(L·fsw); using 0.35 μH yields ΔI ≈ 68.6 A—clearly impractical, so designers must use actual operating V across the inductor and account for bias-reduced inductance when predicting ripple.
3 — Current & Thermal Handling: Irms, ΔT and Derating
"Many engineers overlook the 'Ambient Temperature' reference in the datasheet. If your enclosure reaches 60°C, the 40°C ΔT rise puts the inductor at 100°C. At this temperature, DCR increases by nearly 30% due to the temperature coefficient of copper. Always calculate your losses based on Hot DCR, not the 25°C value, to avoid unexpected thermal runaway in high-density layouts."
4 — Interpreting Datasheet Graphs
Combine I²·DCR and core-loss approximations from the datasheet’s power-loss or impedance plots to estimate total heating. Prioritize the lowest-order plotted lines (total loss vs current) when available; when separate curves are given, sum copper and core losses point-by-point at operating current and frequency and feed into your thermal model for ΔT prediction.
5 — PCB Layout & Implementation Best Practices
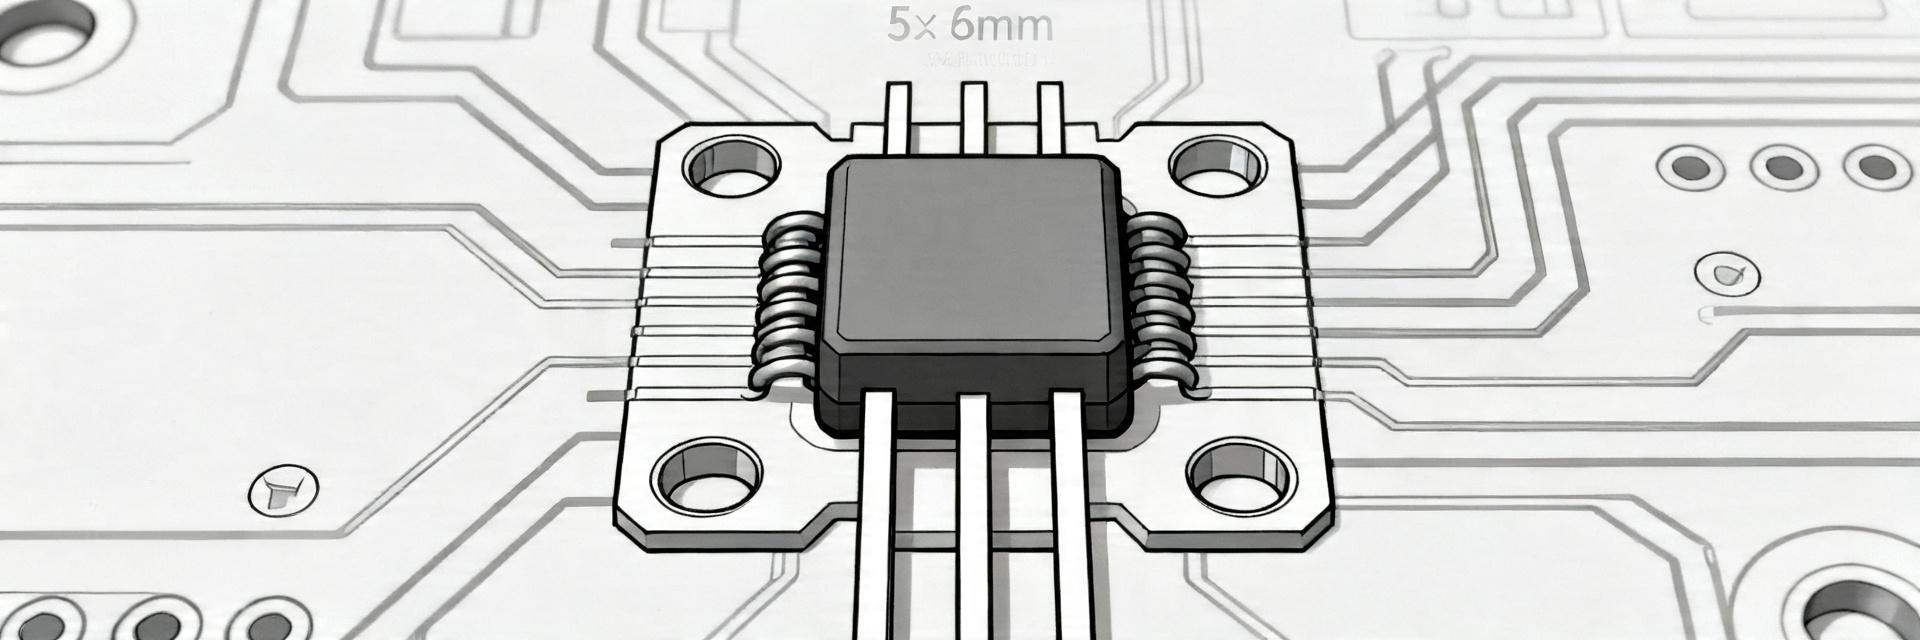
Hand-drawn schematic, not a precise engineering diagram
Footprint and thermal vias
Use the recommended footprint matching the 5.0×5.0 mm package and ensure generous solder fillets for low-resistance termination. Place thermal vias directly under or adjacent to the high-current pads to increase copper cross-section and lower θPCB. For high current (>10 A) runs, multiple vias (4–8) and wide traces or pours on both top and bottom layers reduce effective DCR and hotspot formation.
6 — Application Examples
In a synchronous buck for point-of-load (e.g., 12 V to 1.2 V at 20 A), the 0.56 μH nominal value is chosen for low ripple at moderate switching frequencies; the low DCR keeps I²R losses under a watt. For motor-drive front-ends or LED drivers, the part’s high Isat and soft saturation provide headroom for transients while maintaining efficiency.
7 — Final Selection & Test Checklist
- Saturation Check: Confirm L at peak operating current (not just nominal).
- Thermal Model: Budget I²·DCR using the 100°C DCR value.
- Layout Review: Ensure at least 2oz copper thickness for 20A+ paths.
- EMI: Verify switching node loop area is minimized.
- Bench Test: Use a thermal camera to validate ΔT during 1-hour soak.
FAQ
How does the datasheet define Isat and why does it matter?
Isat is typically defined where inductance falls by a percentage (commonly 30%) under DC bias; it matters because beyond this point the inductor no longer provides the expected reactance, increasing ripple and reducing converter control margin.
Summary
The AMELH5050S-R56MT combines 0.56 μH nominal inductance, milliohm-range DCR, and a compact 5×5 mm shielded package to deliver high-current, low-loss performance for point-of-load and similar applications. Key datasheet graphs (L vs I, DCR, impedance) drive selection decisions: use bias-reduced inductance for ripple sizing, budget I²·DCR into thermal models, and run L vs I plus thermal imaging on prototypes. Use the checklist to validate the part against your converter’s real operating point.





