
The MPIA4020V3-3R3-R sits in a class of compact power inductors where small differences in DCR and saturation behavior translate to measurable converter efficiency deltas. Recent converter benchmarks indicate inductor choice can shift efficiency by several percentage points and define thermal headroom across load ranges, so careful extraction of DC-DC data and realistic bench testing are essential for valid design decisions.
This article centralizes the DC-DC data and practical evaluation steps for integrating a board-level power inductor into modern designs. It focuses on measurable metrics, test waveforms, layout effects, and a repeatable side-by-side plan so engineering teams can quantify efficiency, temperature rise, and inductance under DC bias for informed selection.
Background: MPIA4020V3-3R3-R at a glance
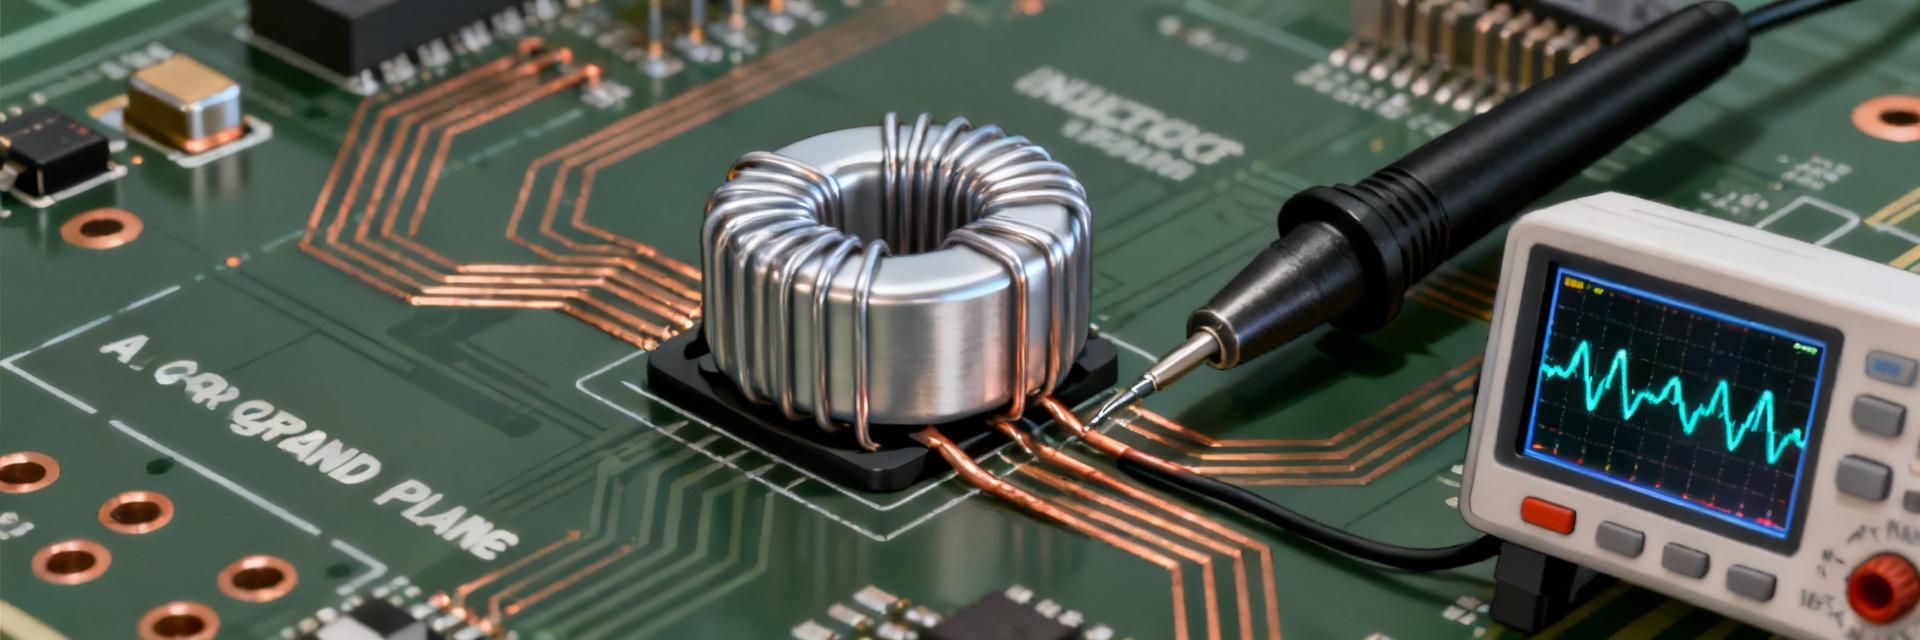
What the part name encodes
Point: The part code encodes nominal inductance and package cues; for example, a “3R3” token conventionally denotes ~3.3 µH nominal value and numeric package hints indicate footprint and height class. Evidence: Datasheet fields list nominal inductance, tolerance, DCR, Isat, Irms and recommended temperature. Explanation: Extracting those values into a minimum viable spec table allows engineers to quickly evaluate inductor suitability for localized power converter designs.
| Parameter | Value | Conditions / Notes |
|---|---|---|
| Nominal Inductance (L) | 3.3 µH ±20% | Measured at 100 kHz, 0.1 Vrms, 0 Adc |
| DC Resistance (DCR Typ) | 48 mΩ | Measured at +25°C ambient |
| DC Resistance (DCR Max) | 58 mΩ | Max limits across production tolerances |
| Saturation Current (Isat) | 4.2 A | Typical inductance drop of ~30% |
| Heating Current (Irms) | 3.3 A | Typical temperature rise of +40°C |
| Operating Temperature | -40°C to +125°C | Includes self-heating thermal rise |
Target topologies and application fit
Point: This inductor family is typically used in synchronous buck and boost topologies and other point-of-load converters. Evidence: Its compact footprint and current ratings fit the typical 1–10 A range. Explanation: Trade-offs include size versus current capability and DCR; choose this component for point-of-load, automotive electronics, or industrial modules when moderate current, a low profile, and predictable DC-bias behavior are required.
Electrical performance: extracting and interpreting DC-DC data
Core electrical metrics to extract
Point: Capture nominal inductance, inductance vs. DC bias curves, DCR and its temperature coefficient, Isat, Irms, SRF, and tolerance. Evidence: These parameters determine ripple, core loss, and thermal behavior under operating current. Explanation: Always report measurement conditions—test frequency, fixture, and PCB placement—because fixture parasitics and nearby copper alter measured L and mask DC-DC performance differences in real converters.
Test waveforms and efficiency impact
Point: Bench tests should include in-circuit ripple current, core loss versus switching frequency, and an efficiency sweep at light, nominal, and peak loads. Evidence: Isolating the inductor’s contribution shows efficiency deltas directly attributable to its DCR and core losses. Explanation: Capture switch-node waveforms and ripple spectra; present efficiency differences at three operating points to quantify how the inductor shifts converter performance across the load profile.
Thermal and saturation behavior under DC bias
Interpreting saturation current and DC de-rating
Point: Inductance falls with DC bias; Isat marks the current where L drops a specified percentage. Evidence: L vs. I curves in datasheets show steep reductions at high DC bias. Explanation: As a rule of thumb, pick an Isat margin above peak inductor current or ensure inductance remains above ~60–70% at operating current for continuous loads; plot L vs. DC current and mark safe operating points for continuous versus pulsed duty.
Thermal rise, layout and cooling effects
Point: Thermal rise depends on DCR, copper layout, and airflow; measured ΔT correlates to losses at steady state. Evidence: A given Irms through a low-DCR winding still produces I²R loss that raises temperature. Explanation: Measure the DC current needed for a target ΔT (for example, ΔT = 40 °C), and document how trace width, copper area, and proximity to hot components change measured rise; include thermal vias and keep clearance from MOSFETs and sense resistors to reduce hotspot coupling.
Integration & selection guide for MPIA4020V3-3R3-R
Selecting inductance and setting ripple targets
Point: Select L to control ripple current and transient response using the standard ripple equation. Evidence: Ripple current ΔIL is computed as ΔIL = (Vin - Vout) * D / (L * f_s) where D = Vout/Vin; designers commonly target ΔIL = 20–40% of Iout in buck converters. Explanation: Higher L lowers ripple but increases physical size and can slow transient response; lower L increases ripple and core loss. Use inductor and DC-DC data (DCR, L vs bias) to balance ripple, loss, and transient performance.
PCB footprint, placement and measurement tips
Point: Layout determines thermal and switching behavior; minimize the switch-loop area and optimize copper for current paths. Evidence: Poor placement increases loop inductance, ringing, and measured losses. Explanation: Place the inductor close to MOSFETs and output caps, use wide short traces for high-current paths, add thermal vias beneath adjacent copper, then verify ripple, switch-node ringing, and steady-state temperature after 30 minutes at worst-case load.
Benchmarking & practical test plan
Side-by-side test plan to compare alternatives
Point: A repeatable test plan isolates inductor performance differences. Evidence: Use identical PCB footprints or adapters, fixed f_s, and defined load points to eliminate confounding variables. Explanation: Record efficiency at light, nominal, and peak loads, capture thermal images, and measure inductance under DC bias; define pass/fail criteria such as maximum ΔT, acceptable inductance drop, and efficiency delta thresholds to guide selection.
How to report DC-DC data for engineers
Point: Publish datasheet-style tables and plots that engineers expect. Evidence: Clear L vs frequency, L vs DC current, DCR vs temperature, Isat/Irms, SRF, efficiency curves, and thermal rise enable direct comparison. Explanation: Produce standardized plots and captions with descriptive titles like “efficiency and thermal performance under 1–10 A loads” so teams can quickly assess inductor suitability for their converter topology.
Summary
- Use the datasheet L vs DC-bias and DCR curves to predict in-circuit performance and margin; validate inductance behavior under expected DC currents.
- Run targeted DC-DC data tests—efficiency at representative loads, thermal rise and inductance under DC bias—to quantify losses and headroom.
- Integrate with a strict layout checklist and the side-by-side test plan to minimize losses and thermal issues when evaluating MPIA4020V3-3R3-R in your converter designs.
Frequently Asked Questions
How do I verify inductance under DC bias for a selected inductor?
Measure inductance on a PCB or adapter using a fixture that supports DC bias current while recording L at the target DC current. Report test frequency, fixture details and ambient conditions. Compare L at operating current to nominal L and apply margin rules to ensure acceptable in-circuit inductance for continuous and pulsed loads.
What test points best reveal inductor impact on converter efficiency?
Run efficiency sweeps at three points: light load (standby), nominal load and peak load. Capture switch-node waveforms and ripple spectra at each point. The inductor’s DCR and core loss contributions are most visible as differences in efficiency and temperature rise across these operating points.
Which PCB layout practices most reduce thermal rise and stray losses?
Minimize switch-loop area, place the inductor close to MOSFETs and output capacitors, use wide short copper for current paths, and add thermal vias under critical pads. Keep the inductor clear of other heat sources and document thermal de-rating so steady-state temperature behavior is predictable under rated current.
How does nominal inductance scale with DC bias and thermal limits on the MPIA4020V3-3R3-R?
Nominal inductance drops progressively as DC current rises, where Isat specifies the point of a typical 30% drop. Concurrently, thermal rise from I²R losses increases winding temperature, which can accelerate saturation and shift the DCR higher due to copper's positive temperature coefficient. Both parameters must be evaluated together at maximum operating temperatures.
Run the side-by-side test plan on your platform to validate real-world performance.





