
Measured DCR and DC current determine conduction losses, thermal rise and usable margin in high-current buck converters; this article walks a design engineer through extracting, interpreting and applying datasheet numbers for practical selection and validation. It focuses on measurable outcomes, test methods and derating rules so readers can move from datasheet fields to validated board-level decisions for MPIA4020V3-R47-R.
This introduction sets the goal: capture the exact datasheet fields you must record, convert DCR to I²R losses and temperature rise estimates, size margins between IDC and Isat, and run repeatable lab tests that reproduce manufacturer conditions for confident part sign-off.
Part overview: key specs to extract from the datasheet (background)
Essential datasheet fields to record
Point: Capture a consistent set of fields for engineering and BOM records. Evidence: use the datasheet table rows and curve captions as the source of truth. Explanation: record inductance (µH) and tolerance, DCR (typ/max, mΩ), rated DC current (IDC), saturation current (Isat or L-drop spec), operating temperature range, package/size, frequency/test conditions and measurement temperature so all later calculations reference identical conditions.
| Field | Example/Unit |
|---|---|
| Inductance | 0.47 µH |
| Inductance tolerance | ±20% |
| DCR (typ / max) | mΩ |
| Rated DC current (IDC) | A |
| Saturation current (Isat / L-drop) | A |
| Test conditions | Temp, frequency |
How those specs map to system-level questions
Point: Translate fields into system tradeoffs. Evidence: DCR governs steady conduction loss via I²R; IDC maps to allowable continuous current for a target temperature rise; Isat defines how much peak current you can tolerate before inductance collapses. Explanation: prioritize low DCR for efficiency-focused designs, prioritize high Isat when dealing with large transient spikes, and prioritize IDC when thermal budget or high ambient temperatures limit continuous current.
DCR deep-dive: measurement, variability and impact (data analysis)
What the datasheet DCR number really means
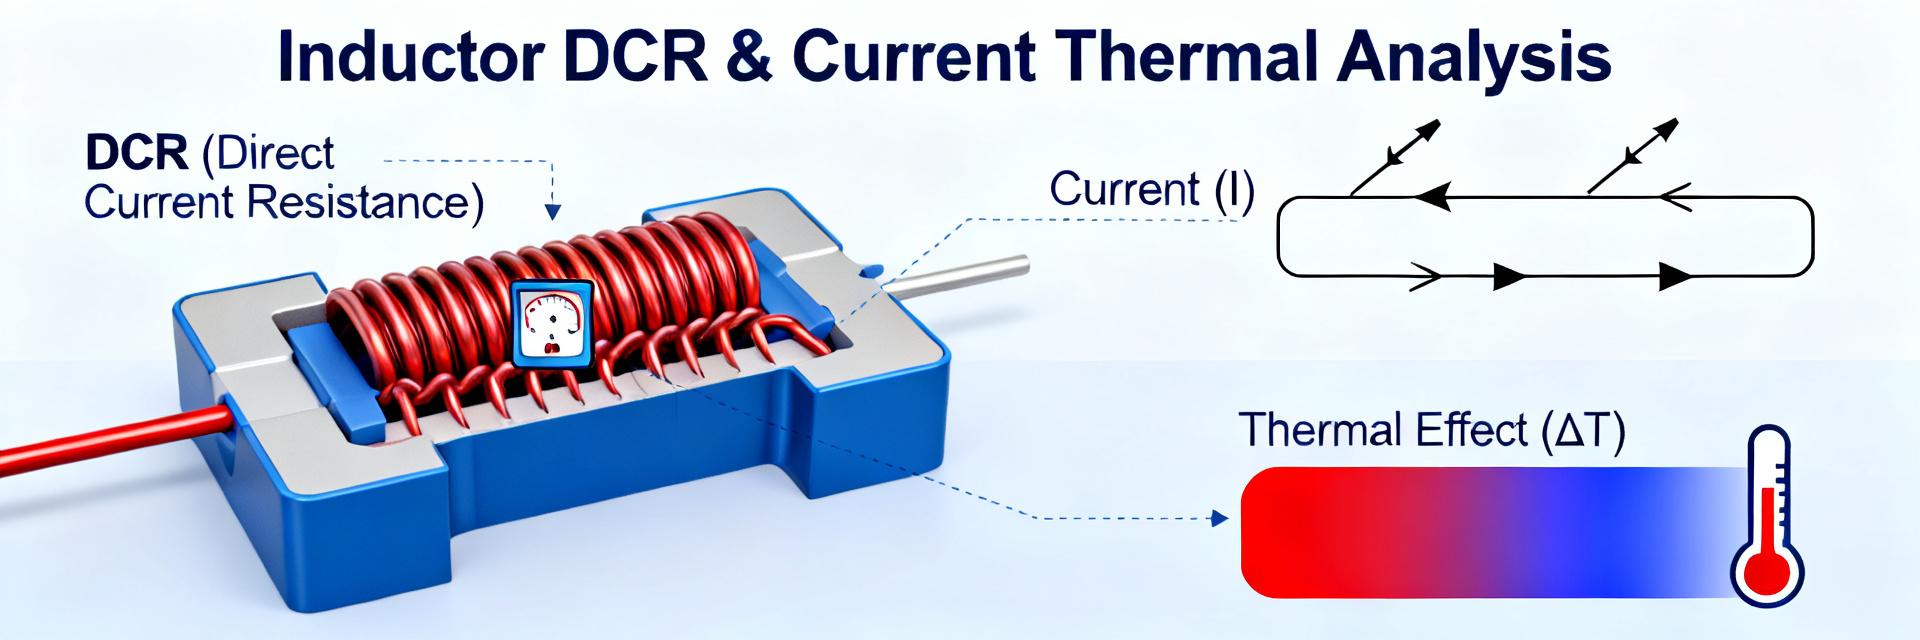
Point: Datasheet DCR is usually given as typical and/or maximum at a stated temperature; it is an ohmic DC series resistance. Evidence: manufacturers measure at a defined temperature and fixture; copper resistivity rises with temperature. Explanation: convert mΩ to Ω and compute conduction loss with P = I²·R. Example: for R = 0.047 Ω, I = 10 A → P = 10²·0.047 = 4.7 W; use thermal resistance (or board thermal tests) to convert that loss into steady-state temperature rise.
Sources of DCR variation in production and layout effects
Point: DCR varies with manufacturing tolerances, copper thickness and layout. Evidence: coil copper cross-section, plating and winding method change resistance; PCB copper, thermal vias and trace length alter effective series resistance seen in-circuit. Explanation: measure DCR with four-wire Kelvin fixtures, specify reporting conventions in the BOM (e.g., DCR max at 25°C), and note that in-system effective losses may be higher when long traces or thin copper are used.
Current rating & derating: interpreting IDC, Isat and thermal limits (data analysis / method)
Distinguishing rated DC current vs. saturation current
Point: Rated DC current is a thermal limit, while saturation current is a magnetic limit tied to inductance drop. Evidence: datasheet curves typically show L vs. I and temperature-rise or IDC defined at a specific ΔT. Explanation: size steady-state margin using IDC (for example, keep operating current below ~80% of IDC for conservative thermal headroom) and size transient margin against Isat to prevent inductance collapse during switching peaks.
Thermal derating & ambient/PCB considerations
Point: Derate IDC for higher ambient, reduced copper, or limited airflow. Evidence: thermal mapping relates power loss to temperature rise: ΔT = P_loss × R_th(board). Explanation: compute P_loss = I²·DCR, estimate R_th from PCB copper and vias or from thermal soak tests, then compute allowed steady current by solving I_allowed = sqrt(ΔT_target / (R_th × DCR)). Validate with thermal imaging and soak tests on the actual board layout.
Measurement & test procedures: practical lab steps (method guide)
Recommended test setup for accurate DCR and current tests
Point: Use controlled, repeatable setups to match datasheet conditions. Evidence: four-wire DCR meters, low-inductance current sources and fixtures reduce measurement error; heating during measurement alters resistance. Explanation: steps: 1) four-wire DCR at specified temperature, 2) L vs. I sweep with a DC current source and L-meter, 3) measure temperature rise with a thermocouple or thermal camera while sourcing steady current, and 4) document fixture geometry and ambient for traceable results.
Interpreting test results vs. datasheet curves
Point: Overlay measured curves on datasheet plots to reveal shifts. Evidence: small offsets in DCR or L vs. I are acceptable within manufacturing tolerances; systematic offsets suggest wrong part, fixture error or lot issue. Explanation: establish pass/fail criteria (e.g., DCR_meas ≤ DCR_max + tolerance, L_drop ≤ Isat definition), use statistical sampling (e.g., 5–10 parts per lot for incoming inspection), and flag lots where more than the allowed fraction exceed limits for rework or rejection.
Design integration & selection checklist (actionable guidance / case-oriented)
PCB, thermal and EMI integration checklist
Point: Layout drives both thermal and EMI outcomes. Evidence: placement relative to switching node, copper pour area and thermal vias change losses and radiated emission. Explanation: do: land the part close to the switching FET, use generous PCB copper and thermal vias beneath the pad, provide a low-impedance return plane, keep loop area small, and add input/output decoupling close to the inductor. Don’t: route narrow traces from inductor pads or place sensitive analog nets nearby.
When to choose an alternate inductor or derate
Point: Decide based on efficiency, thermal budget and size. Evidence: if steady-state I²R loss consumes more than your efficiency budget or yields high temperature rise on your board, select lower DCR or larger package. Explanation: use a simple rule: if P_loss > X% of converter losses budget or ΔT exceeds target, either select a part with lower DCR or increase PCB copper/airflow; document measured DCR, thermal test and L vs. I for final sign-off.
Key summary
- Extract and record inductance, tolerance, DCR (typ/max), IDC and Isat with test conditions to enable consistent engineering comparisons and calculations using the datasheet.
- Convert DCR to conduction loss with P = I²·R and map loss to temperature rise using board thermal resistance; validate with thermal imaging for true in-circuit behavior.
- Derate IDC for ambient, copper and airflow limits; size headroom against Isat for transients and use four-wire, fixture-controlled tests for repeatable DCR results.
FAQ
How do I measure DCR for MPIA4020V3-R47-R accurately?
Use a four-wire Kelvin measurement at the datasheet reference temperature, minimize lead length and fixture resistance, and avoid heating the part during measurement. Document fixture geometry and measurement temperature so results trace to the datasheet conditions and are comparable across lots.
How should I derate the current rating for higher ambient temperatures?
Compute power loss (P = I²·DCR), estimate board thermal resistance to ambient, then solve for allowable I such that ΔT stays within your target. Validate with steady-state soak tests on the populated board and adjust derating if thermal imaging shows hotspots.
What pass/fail criteria should I use for incoming inductors regarding DCR and current rating?
Pass if measured DCR ≤ datasheet DCR_max plus agreed tolerance and if thermal tests at intended operating current produce ΔT below your design limit. Use statistical sampling (e.g., 5–10 units per lot) and escalate if outliers exceed tolerances or exhibit atypical L vs. I behavior.
What is the operational difference between IDC and Isat for this 0.47µH inductor?
IDC is purely a thermal limit determined by power dissipation and temperature rise (typically 40°C), while Isat is a magnetic limit defined by the DC bias current at which the inductance rolls off by a specific percentage (typically 30%) from the initial value.





