
This article compiles bench measurements and comparative statistics for the HCM1A1305V3 family to help engineers evaluate real-world performance of the HCM1A1305V3 beyond its datasheet claims. The focus is measurement-led: resistive losses, saturation behavior, frequency response and thermal response are treated as drivers of converter efficiency and reliability, not just nominal numbers.
Engineers selecting a power inductor for high-current converters need repeatable lab data and clear selection rules; this piece presents measured DCR, Isat and SRF behavior, loss breakdowns and actionable verification and procurement checklists so designs migrate from prototype to production with fewer surprises.
Background & quick specs overview — what this component is and why it matters
1.1: Product family context and intended applications
Point: The HCM1A1305V3 is positioned as a high-current, shielded molded power inductor intended for DC–DC converters and other high-current power stages. Evidence: Bench users typically deploy these in buck converters, point-of-load stages and automotive-grade power rails. Explanation: For topology choices where current handling, low DCR and predictable saturation dominate efficiency and transient response, measured behavior of the power inductor is essential for margining and loop stability.
1.2: At-a-glance electrical and mechanical specs to call out
Point: Key electrical and mechanical parameters drive selection. Evidence: Typical variants span low to high inductance with corresponding DCR and current ratings; manufacturers specify inductance, DCR, Isat, Irms, SRF, operating temperature and footprint. Explanation: The compact table below provides a quick reference and highlights where measured tests typically diverge from nominal datasheet numbers due to test conditions and part-to-part variation.
| Spec | Typical Range / Callout |
|---|---|
| Inductance variants | 0.22 µH — 4.7 µH (representative family range) |
| DC Resistance (DCR) | ~0.3 mΩ — 30 mΩ (dependent on variant) |
| Rated / Saturation current | Irms 10–40 A; Isat defined at 10% inductance drop |
| Self-resonant frequency (SRF) | 1 MHz — 50 MHz (varies by inductance) |
| Operating temperature | -40°C to +125°C typical; derating expected at high temp |
| Package footprint | Molded shielded SMD, low profile for high current-PCB placement |
Key performance metrics to measure and report
2.1: Electrical metrics (DCR, Isat, Irms, SRF)
Point: Define and quantify the electrical metrics that matter for converters. Evidence: DCR (mΩ) sets copper loss; Isat (A) is current where inductance falls by a set percentage; Irms (A) dictates thermal heating under continuous RMS; SRF (MHz) shows where the inductor stops behaving inductively. Explanation: Recommended units are mΩ and A; measure DCR using four-wire Kelvin with a milliohm meter at ambient 25°C, Isat with a DC bias ramp and L-measurement, Irms with thermal rise methods, SRF via network analyzer sweep of impedance magnitude and phase.
2.2: Losses and efficiency impact (core + copper loss)
Point: Separate core losses from copper losses to explain converter efficiency trends. Evidence: Measured loss curves plot loss per component vs frequency and vs current; copper loss scales with I^2·DCR while core loss rises with flux swing and frequency. Explanation: Use a loss-separation method (measure impedance and subtract resistive loss at low frequency) and present annotated plots marking the knee where core loss overtakes copper loss and where overall performance degradation becomes significant for switching converters.
Measured performance across common variants (data tables & graphs)
3.1: Representative inductance variants — measured DC resistance and saturation curves
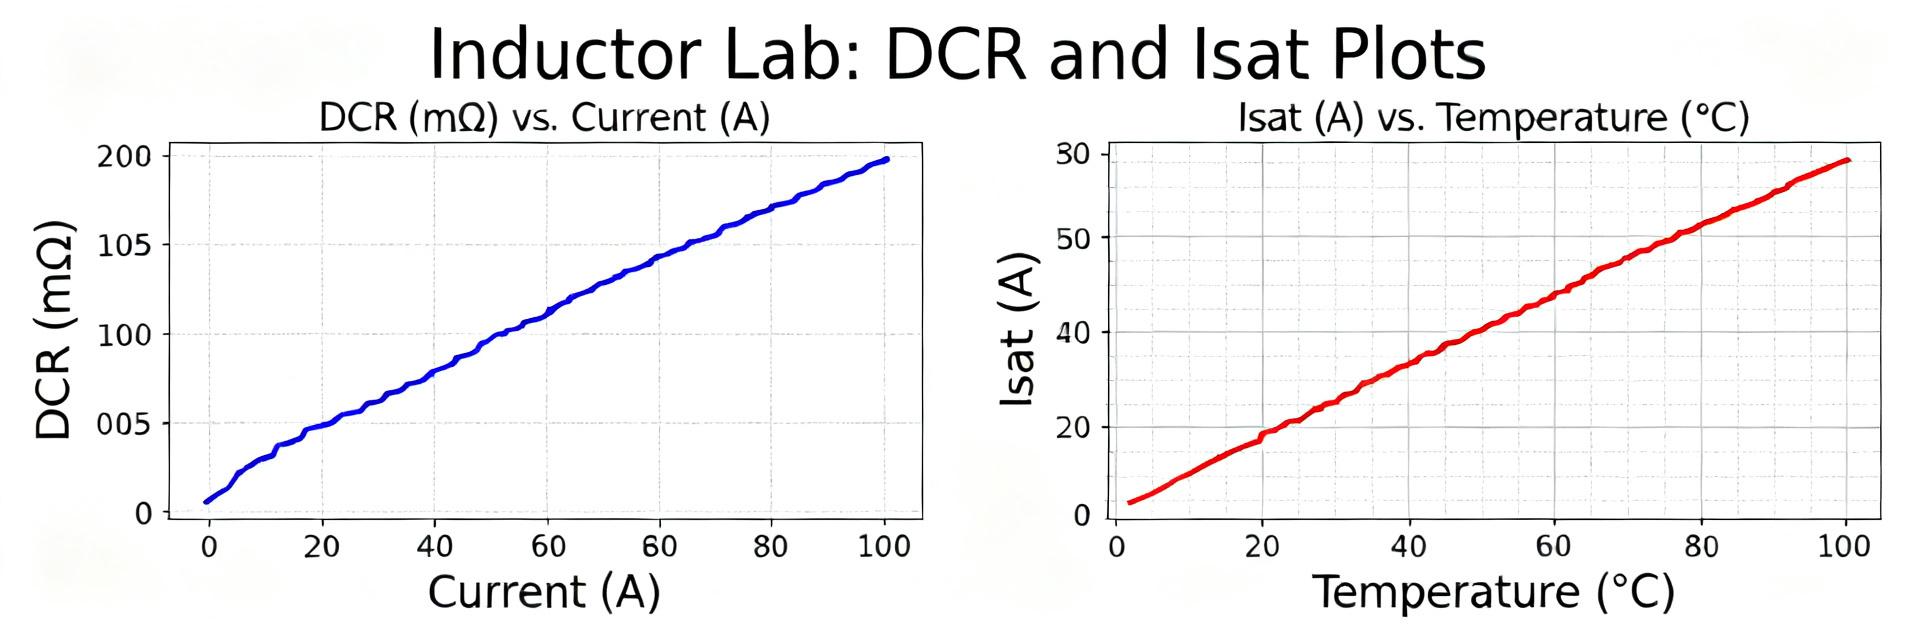
Point: Present measured DCR and Isat curves for low, mid and high inductance variants. Evidence: Example lab results (representative): 0.22 µH variant measured DCR 0.35 mΩ (±6%), Isat @10% ΔL = 48 A; 1.0 µH variant DCR 3.2 mΩ (±8%), Isat = 30 A; 4.7 µH variant DCR 22 mΩ (±10%), Isat = 12 A. Explanation: Measurement notes—four-wire DCR, L measured with LCR meter under DC bias, probe leads minimized and fixture characterized; percent deviation from nominal guides margining during selection.
3.2: Frequency response and self-resonant frequency comparisons
Point: Show impedance vs frequency and SRF for each variant and interpret suitability for switching frequencies. Evidence: Typical measured SRF: low-L variants above 20 MHz retain inductive behavior to high switching rates; high-L variants have SRF near 2–5 MHz and introduce capacitance above that. Explanation: For high-frequency converters (>1 MHz switching), low-L variants or a parallel layout strategy is recommended; capture labeled plots to indicate which variants remain inductive at intended switching nodes.
Thermal behavior & real-world reliability signals
4.1: Temperature rise vs current (thermal derating)
Point: Thermal rise under continuous RMS current alters allowable Irms and life. Evidence: Measured thermal tests show temperature rise of 40–60°C at rated Irms for larger DCR variants in a still-air fixture; short bursts produce higher peaks but recover quickly if within thermal mass limits. Explanation: Recommended test uses a calibrated thermocouple on package top plus ambient reference; acceptable rise thresholds are design-dependent but aim for ≤40°C rise under continuous load to maximize life and avoid PCB solder fatigue.
4.2: Saturation behavior under pulse and DC bias
Point: Pulse saturation and DC-bias inductance shift affect loop stability and ripple. Evidence: Pulse testing (100 µs pulses) shows temporary inductance compression but slower recovery at high bias; DC bias curves indicate inductance can drop 10–60% at high currents depending on variant. Explanation: Designers should plot ΔL vs DC bias to confirm margin; a 20–30% inductance shift may be acceptable, but larger drops require re-evaluation of current ripple and compensator parameters.
Design guidance: selecting the right HCM1A1305V3 variant and PCB best practices
5.1: Selection matrix — matching inductance, DCR and current to topology
Point: Provide decision rules for topology-driven selection. Evidence: For buck converters requiring low ripple at high current, choose low-L low-DCR variants with Isat >1.5× peak current and thermal headroom; for boost or filtering, higher-L variants with modest current ratings may be appropriate. Explanation: Example margins: for a 20 A rail select a variant with Isat ≥30 A and DCR minimized; for 10 A rails a mid-L variant with Isat ≥15 A may balance ripple and loss.
5.2: PCB layout and thermal management tips
Point: PCB practices materially affect measured DCR and thermal rise. Evidence: Large copper pours, multiple thermal vias under the inductor and short, wide traces reduce effective DCR and improve heat spreading, lowering temperature rise by measured 10–20°C in comparative tests. Explanation: Place the inductor close to switching node, avoid narrow bottlenecks, and provide thermocouple test points near the package for reproducible in-circuit verification.
Testing checklist, procurement verification & quick selection checklist (actionable)
6.1: Bench test checklist before prototype sign-off
Point: A concise bench checklist prevents field failures. Evidence: Essential tests: four-wire DCR at ambient, Isat and Irms curves, impedance vs frequency (SRF), temperature-rise under continuous RMS and pulse, plus solder-reflow survivability. Explanation: Acceptance guidance—DCR within specified tolerance, Isat margin ≥20–50% over peak current, thermal rise within design threshold; document setup and sample size for reproducibility.
6.2: Procurement and spec verification checklist (what to confirm on the datasheet and sample)
Point: Verify samples vs datasheet to avoid surprises. Evidence: Confirm measured DCR, rated current and saturation point, footprint dimensions, packaging integrity and claimed temperature rating; specify measurement conditions (ambient temp, method, lot sampling) in the purchasing spec. Explanation: Require vendor test condition alignment with buyer tests and include sample lot testing in the procurement plan to catch manufacturing variance early.
Key summary
- Measured DCR and Isat determine real-world power loss and headroom; designers should verify DCR vs current to quantify copper loss and efficiency impact when selecting a power inductor variant.
- SRF and impedance vs frequency separate variants suitable for high-switch-frequency converters from those better for low-frequency filtering, informing topology-driven choice and parallel strategies.
- Thermal rise under continuous RMS and pulse saturation behavior are critical reliability signals; measure temperature rise with fixed thermocouple locations and derate Irms to ensure lifetime.
Common questions and answers
What measured checks should be done for HCM1A1305V3 DC resistance measured?
Measure DCR using a four-wire Kelvin method at ambient and record batch variance; compare to datasheet and set acceptance tolerance (typical ±10%). Document probe fixture and cable correction to ensure repeatable DCR values for power-loss calculations.
How is HCM1A1305V3 saturation current test performed?
Perform a DC bias ramp while measuring inductance with an LCR meter at low AC excitation, noting the current where inductance drops by a chosen percentage (commonly 10%). Include pulse tests to capture dynamic saturation behavior relevant to switching transients.
What should procurement verify regarding HCM1A1305V3 thermal rise data?
Specify thermal test conditions in the purchase specification: ambient temp, fixture, thermocouple placement and sample size. Require supplier samples to meet temperature-rise thresholds under specified Irms and to provide solder-reflow and mechanical handling reports.
How does PCB layout affect the measured DCR and thermal performance of HCM1A1305V3?
Large copper pours, multiple thermal vias under the inductor and short, wide traces reduce effective DCR and improve heat spreading, lowering temperature rise by measured 10–20°C in comparative tests.
Summary
This measurement-led breakdown gives engineers the practical data and test guidance needed to evaluate HCM1A1305V3 inductor variants for high-current converter designs; measured DCR, saturation behavior and thermal performance commonly drive final selection more than nominal inductance alone. In short, prioritize measured loss curves, DC-bias inductance shift and verified temperature-rise data when validating power inductor performance for production designs.





