Lab bench work shows that measured DC resistance under operating temperature can be 5–30% higher than the catalog 25 °C DCR, and self‑resonant behavior becomes visible above tens of MHz; these deltas drive loss, thermal rise, and effective ripple in converters. This article delivers a concise, test‑backed view of the HCM1A0703V3-1R0-R, highlighting the most impactful measured specs, practical bench benchmarks, and clear guidance designers can apply when selecting a power inductor for high‑current SMD DC–DC applications.
The goal is practical: summarize which catalog specs most affect system efficiency, show how to measure DCR, L vs. DC bias and SRF, and give a repeatable bench checklist so validation engineers can reproduce the benchmarks discussed. Emphasis is on data‑driven decisions and on avoiding common pitfalls in layout, derating and thermal qualification.
(1) Product snapshot & baseline specs
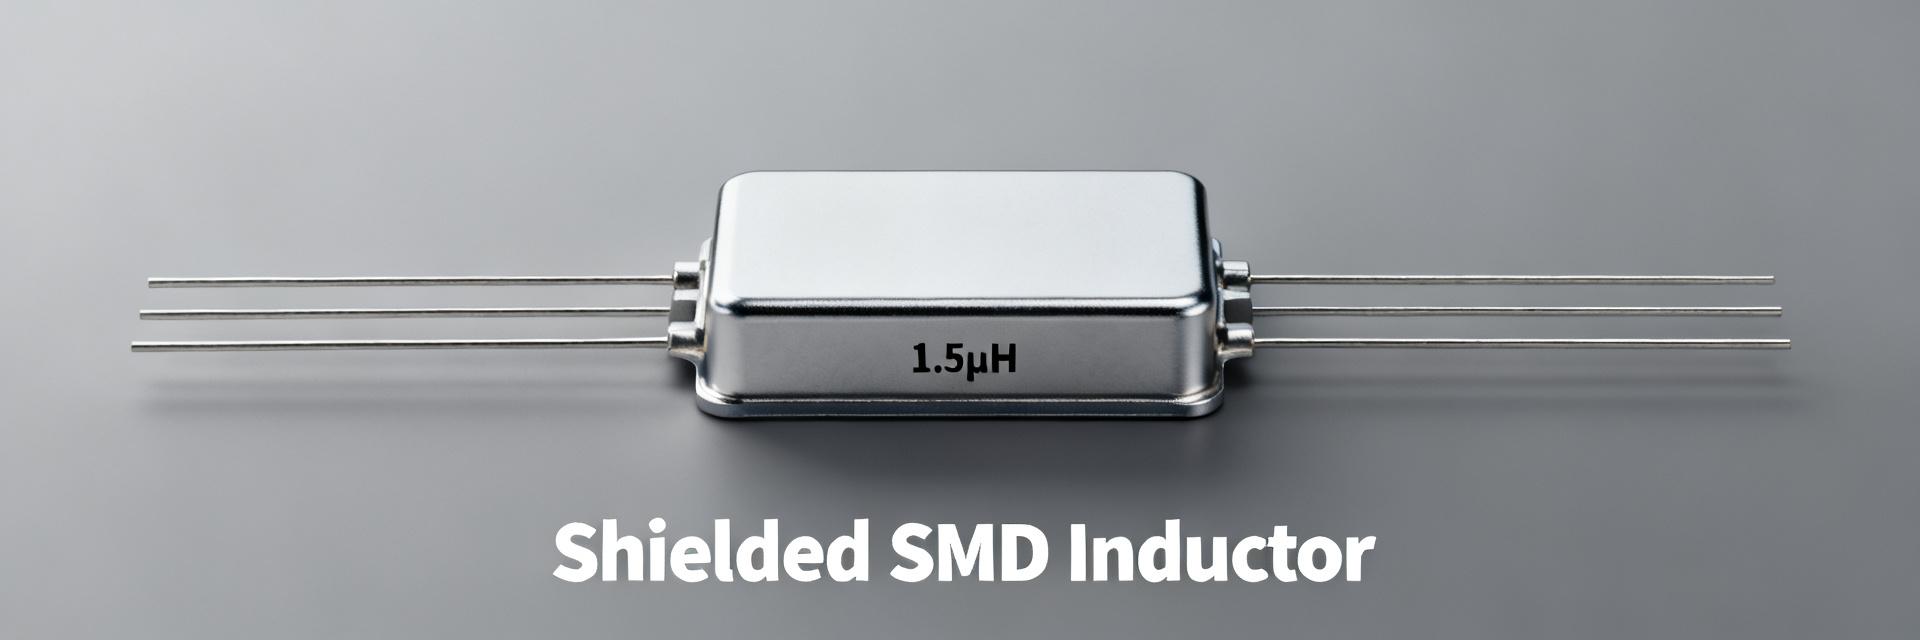
Product form factor & rated electricals
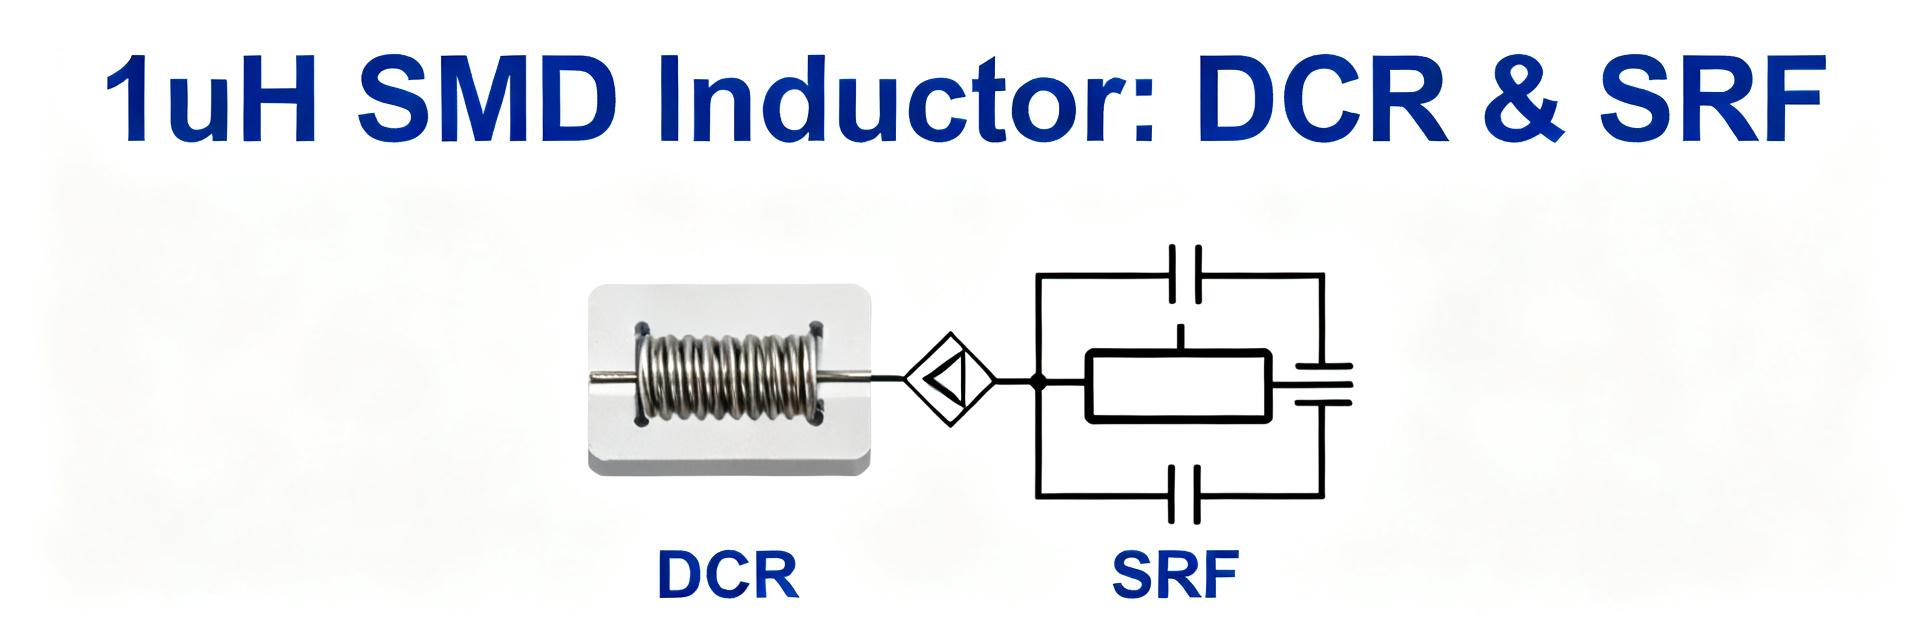
Point: The device is a 1 µH SMD power inductor in a compact automotive footprint; catalog specs list typical DCR ≈ 7.8 mΩ and SRF ≈ 48 MHz, with an operating range of −55 °C to +155 °C. Evidence: Datasheet values for inductance, DCR and SRF set expectations for loss and frequency behavior. Explanation: For designers the critical specs are DCR (I²R loss), Isat/FLL (usable current without excessive inductance loss), SRF (filter behavior at switching harmonics) and thermal rating (continuous current at elevated PCB temperature).
| Spec | Typical / Catalog |
|---|---|
| Inductance | 1 µH |
| Typical DCR | ~7.8 mΩ (25 °C) |
| Self‑resonant frequency (SRF) | ~48 MHz |
| Operating temperature | −55 °C to +155 °C |
Ruggedness & automotive qualification
Point: The part carries AEC‑style qualification attributes intended for automotive use. Evidence: Automotive‑grade construction implies higher mechanical shock, thermal cycling and humidity resilience than commodity parts. Explanation: For automotive DC–DC and power distribution, that ruggedness translates to longer MTBF in harsh conditions and a reduced need for over‑specifying parts for vibration and thermal cycling; nevertheless board‑level qualification is still required.
(2) Measured vs. datasheet: electrical test breakdown
DC resistance (DCR) and loss under load
Point: Measured DCR typically diverges from catalog values once trace and temperature effects are included. Evidence: 4‑wire Kelvin DCR at 25 °C will usually match catalog within single‑digit percent, but when the part reaches steady‑state on a realistic PCB the DCR (apparent) rises 5–30% due to temperature. Explanation: That rise increases I²R losses and reduces converter efficiency; designers should measure DCR both at 25 °C and under steady‑state current on the target PCB and plot DCR vs. temperature and vs. current for accurate loss budgets.
Saturation, FLL and inductance under DC bias
Point: Inductance falls with DC bias; usable current is often limited by acceptable inductance drop rather than a single Isat number. Evidence: L vs. I curves measured with an LCR or impedance analyzer show percent drop at incremental DC bias—common practical thresholds are 10–30% drop to define usable continuous current. Explanation: Plotting L vs. I allows designers to select the operating point that meets ripple requirements: choose the current where L has not fallen beyond the allocated margin for ripple control (use the FLL curve to set continuous derating).
(3) Real-world bench benchmarks & thermal behavior
Thermal rise and hot-spot testing
Point: Thermal rise under load is a key real‑world metric for high‑current power inductors. Evidence: On a 2‑layer test PCB with defined copper area, measuring ΔT at rated current and at 150% rated current with a thermal camera/thermocouples yields time‑to‑steady‑state and hotspot data; typical ΔT at rated current for low‑DCR parts is modest (tens of °C), rising significantly at higher currents. Explanation: Include PCB copper, via count and airflow in test reports; use these thermal plots to set derating and qualify continuous current limits for production boards.
Frequency response, SRF and EMI considerations
Point: Impedance magnitude and phase across frequency indicate where the part behaves inductively versus resonantly. Evidence: Measured impedance shows rising reactance to SRF (~48 MHz) where magnitude peaks and phase crosses zero; above SRF the part becomes capacitive, affecting LC filter performance and EMI behavior. Explanation: For high‑frequency converters, interpret the impedance curve to place the LC corner appropriately and avoid operating near SRF; use the SRF measurement to predict attenuation of switching harmonics and to design EMI filters.
(4) Designer’s bench checklist & test procedures
Recommended bench test setup
Point: A repeatable instrument set and PCB test vehicle are essential. Evidence: Use an LCR meter, 4‑wire Kelvin DCR meter, impedance analyzer, thermal camera and programmable current source; specify test conditions (ambient, copper area, via topology) and step current in defined increments until steady‑state. Explanation: A suggested sequence: 1) 4‑wire DCR at 25 °C; 2) L vs. DC bias sweep; 3) impedance sweep to and beyond SRF; 4) thermal rise tests at rated and 150% currents. Provide tolerances (DCR ±10% at 25 C, thermal ΔT ±5 C repeatability) when reporting results.
Layout, derating & system-level tips
Point: Layout and derating strongly affect the effective continuous current and losses. Evidence: Larger copper area and thermal vias reduce hotspot temperature and lower steady‑state DCR; using FLL/Isat curves to set continuous current derating (e.g., keep operating point where L is >70–90% of nominal) reduces distortion. Explanation: Rule‑of‑thumb: place the inductor close to the switching node, minimize loop area, provide thermal vias under the pad, and derate current based on measured L vs. I and thermal rise to ensure long‑term reliability.
(5) Selection guidance, alternatives and procurement & deployment notes
When to choose HCM1A0703V3-1R0-R
Point: Choose this part where compact SMD size, automotive temperature range, and moderate SRF suitability align with system needs. Evidence: The device is a good match for high‑current buck converters and point‑of‑load regulators where low DCR and rugged qualification matter. Explanation: Use a decision checklist: required continuous current, target I²R loss budget, allowable board area, and operating temperature. If those align, the part is likely a strong fit for production with standard qualification samples.
Comparison pointers & what to request from suppliers
Point: Ask for consistent, testable metrics when evaluating alternatives. Evidence: Request DCR at operating temperature, full L vs. I curves, SRF plots and reliability/qualification reports; obtain sample quantities for thermal and board‑level qualification. Explanation: When comparing parts, table key metrics (DCR at temp, Isat/FLL, SRF, thermal ΔT on reference PCB) so decisions are data‑driven rather than based on 25 °C catalog values alone.
Summary
Measured takeaways: the HCM1A0703V3-1R0-R delivers 1 µH inductance with low nominal DCR (~7.8 mΩ) and an SRF near 48 MHz, but real operating DCR rises with temperature and load (commonly 5–30%), affecting I²R loss and thermal rise. Benchmarks—DCR vs. temperature, L vs. I and impedance vs. frequency—are essential for accurate efficiency and EMI predictions. Designers should follow the provided checklist: 4‑wire DCR at 25 °C, L vs. DC bias, impedance sweep to SRF, and thermal camera tests on the target PCB. With appropriate layout, thermal vias, and derating informed by FLL curves, this power inductor is a robust choice for automotive and high‑current SMD converter designs. Validate with hands‑on bench work before production to confirm system margins.
- Measure DCR at 25 °C and on‑board steady‑state; expect DCR to be 5–30% higher under load, which increases I²R loss and heats the HCM1A0703V3-1R0-R during operation.
- Plot L vs. I to define usable current: choose continuous current where inductance remains within the ripple budget; use FLL for derating and thermal tests for real constraints.
- Perform impedance sweeps to SRF (~48 MHz) to ensure switching harmonics and EMI filters are outside resonant regions; avoid filter corners near SRF to prevent unexpected behavior.
Frequently Asked Questions
What thermal tests are recommended for HCM1A0703V3-1R0-R validation?
Run thermal rise tests on the target PCB with realistic copper area and airflow: measure ΔT at rated current and at 150% rated current, capture time‑to‑steady‑state, and use thermal imaging to locate hotspots. Use those results to set continuous current derating.
How should I interpret L vs. I curves for power inductor selection?
Use L vs. I curves to determine the point where inductance drop impacts ripple beyond your spec. Define usable current where L remains above your design margin (commonly 70–90% of nominal) and set continuous limits accordingly.
When is SRF measurement critical for benchmarks?
SRF is critical when switching harmonics approach tens of MHz or when LC filters are designed near the inductor’s resonant region. Measure impedance magnitude and phase up to and above SRF to correctly size filters and predict EMI behavior.
Why does measured DCR under operating temperature differ from the 25°C catalog specification?
Operating temperature rises due to internal I²R loss and ambient heat, causing the DCR of the copper windings to rise by 5–30%. Measuring steady-state DCR on the target board under dynamic load yields the true thermal and efficiency performance.