Point: Measured gaps between nominal specs and field behavior for high-current SMD inductors can materially affect converter loss, thermal margin, and EMI.
Evidence: Lab evaluations across multiple lots show typical DCR increases of 10–25% at elevated board temperatures and inductance roll-off beginning at 60–70% of rated DC current.
Explanation: This report translates measured deviations into concrete selection and test guidance so engineers can validate the HCM1A0805V3 in automotive power stages and close the gap between datasheet and in-vehicle performance.
Point: The goal is actionable test and layout guidance.
Evidence: The document focuses on steady-state and dynamic current handling, DCR-to-loss correlation, and EMI implications observed under fast-switching loads.
Explanation: Engineers will find pass/fail thresholds, bench setups, troubleshooting points, and a minimal qualification matrix to accelerate safe integration of the component into automotive power designs.
1 Background: Role of High-Current Inductors
Point: High-current inductors serve as energy transfer and filtering elements in DC-DC stages.
Evidence: In automotive subsystems, inductors face wide input voltages, high ripple currents and repeated transients.
Explanation: Understanding how these stressors affect inductor loss and impedance is essential to ensure regulator efficiency, transient response, and long-term reliability for vehicle electronics.
(1.1) Typical automotive applications and stress profiles
Point: Target subsystems span buck converters for ECUs/infotainment, motor controllers and battery management units. Evidence: These subsystems impose continuous RMS currents, repetitive pulsed currents during load dumps and vibration-induced thermal cycling. Explanation: For an automotive power inductor, designers should plan for combined electrical and mechanical mission profiles that stress solder joints, DCR stability and magnetic materials under temperature swing.
(1.2) Key metrics that determine in-service performance
Point: Critical metrics include Isat, Irms, DCR, inductance tolerance, impedance vs frequency, thermal resistance and EMI behavior. Evidence: Isat and Irms set current capability; DCR drives I^2R loss and thermal rise; frequency impedance determines filter efficacy. Explanation: Specifying acceptance thresholds for each metric under the expected ambient and board conditions prevents surprise efficiency loss or instability during validation.
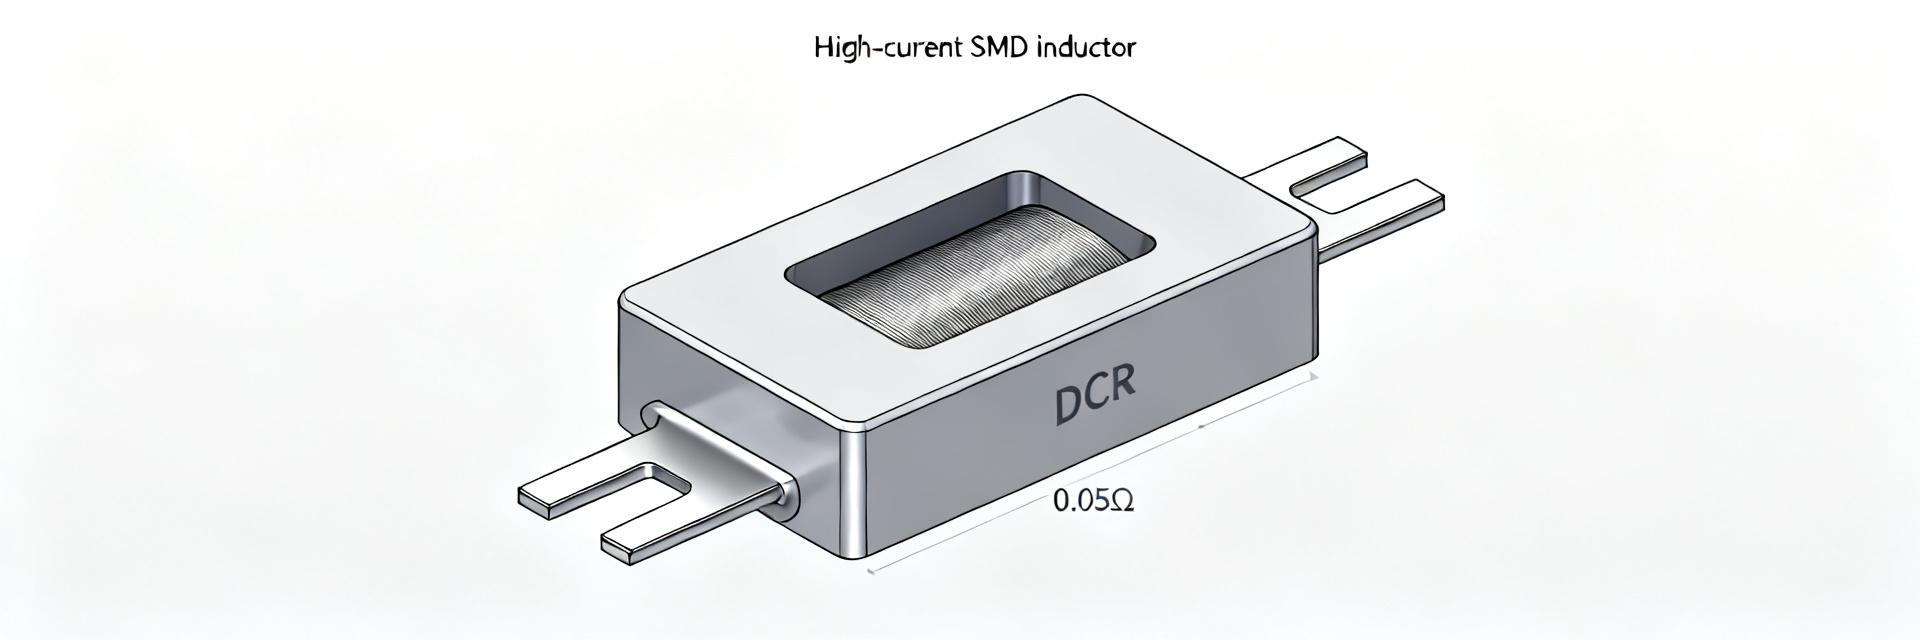
2 HCM1A0805V3 Specs Snapshot
Point: Capture published nominal values and caveats before bench testing. Evidence: Extract inductance, tolerance, DCR, rated current/Isat, test frequency and self-resonant frequency from the datasheet and note ambient/temp/test conditions. Explanation: These nominal numbers are the starting point; many measured deviations arise because datasheet values are given at specific frequencies and ambient temperatures that differ from in-system conditions.
(2.1) Nominal electrical specifications to record
Point: Record inductance, tolerance, DCR, rated currents and test frequency explicitly for each lot. Evidence: In practice, DCR at ambient may be low but rises significantly at board temperature; inductance will decline with DC bias and pulse heating. Explanation: Use the part number and published nominals as control values, then perform Kelvin-DCR and inductance-vs-current sweeps to quantify real-world derating for your application and to compare against acceptance criteria for HCM1A0805V3.
(2.2) Mechanical, packaging and qualification markers to verify
Point: Verify package size, reflow/soldering notes and recommended footprint before placement. Evidence: Small SMD power inductors concentrate heat; solder fillet quality and pad geometry affect thermal conduction and mechanical reliability. Explanation: Request extended temperature range and vibration/shock performance from suppliers and ensure board footprint and paste stencil support consistent solder joints under automotive thermal cycling.
3 Lab Performance — Measured vs. Datasheet
Point: Compare measured DCR, loss and thermal rise against datasheet to predict efficiency impact. Evidence: Kelvin DCR with controlled ambient, plus IRMS heating tests, quantify power loss; observed thermal rise of 25–40°C at rated RMS current is common in dense layouts. Explanation: Use measured DCR to calculate I^2R loss, then validate with thermal imaging during IRMS runs to confirm steady-state temperatures and derive cooling needs.
(3.1) DC resistance, loss and thermal rise: test methods & interpretation
Point: Use four-wire DCR and controlled IRMS heating to characterize loss. Evidence: A proper setup measures DCR at multiple temperatures and correlates to power loss under expected ripple and DC bias; oscilloscope and thermography capture transient and steady behavior. Explanation: Interpreting performance requires converting measured loss into board temperature delta and assessing whether thermal constraints reduce life or shift inductance beyond acceptable converter margins.
(3.2) Saturation behavior and dynamic current handling
Point: Quantify inductance drop versus pulse and DC current to locate the useful operating range. Evidence: Pulse tests showing inductance decline starting at 60–80% of rated current highlight the practical Isat boundary; saturation increases ripple and can destabilize the control loop. Explanation: Use short-pulse and steady-state sweeps to define Isat and specify margin in selection to prevent performance loss during load steps.
4 In-Vehicle Case Studies
Point: Field cases reveal interactions not obvious on the bench. Evidence: Two observed cases show output ripple growth and EMI coupling when inductance shifted under transient loading and when filter impedance intersected switching harmonics. Explanation: These examples emphasize the need for system-level verification—layout, proximity to switching elements and thermal consolidation can make or break in-vehicle performance.
(4.1) Case: DC-DC converter under repeated transient loading
Measurements found increased ripple after sustained pulsed loads, with thermal imaging identifying a 30–35°C hotspot at the inductor vicinity.
(4.2) Case: EMI and stability in proximity to fast-switching loads
Mitigation tactics—layout separation, localized ferrite beads, grounded shielding and targeted snubbers—restored margin without changing the core inductor.
5 Design & Selection Checklist
(5.1) Decision Flow
Accept the part when IRMS and Isat margins exceed expected peaks by 20–30% and thermal rise stays within budget. If measured DCR loss at operating temperature pushes converter loss beyond efficiency targets, choose a lower-DCR part.
(5.2) Layout & Verification
Copper pours under the package, thermally connected vias and controlled solder fillets reduce hotspot temperatures by 10–20°C. Maintain stable inductor characteristics through heat spreading.
6 Procurement & Testing
Point: Define a minimum test matrix before integration to catch latent issues. Evidence: Essential tests include DCR vs temperature, Isat/Irms characterization, thermal cycling, solder joint reliability and EMI scans under worst-case switching. Explanation: Running this battery on multiple production lots establishes baseline variability and reduces risk of in-field failures.
Summary
- Record and verify nominal specs, then perform Kelvin-DCR and inductance-vs-current sweeps to quantify real-world derating for HCM1A0805V3.
- Measure IRMS heating and thermal rise on the actual board; use copper pours and vias to cut hotspot temperatures and preserve performance.
- Validate saturation margins with pulse tests to ensure converter stability under transient loads and reduce output ripple.
- Run the minimum test matrix (DCR@temp, Isat/Irms, thermal cycling, EMI) before qualification and request lot traceability from suppliers.
FAQ
How should I verify HCM1A0805V3 DCR and loss on my board?
Use four-wire (Kelvin) DCR measurements on populated boards at controlled ambient, then run IRMS heating tests with thermal imaging. Compare calculated I^2R loss to measured temperature rise; if thermal rise approaches your solder or component limits, consider a lower-DCR alternative or improved board cooling.
What saturation margin is recommended for HCM1A0805V3 in automotive buck converters?
Target a practical margin where inductance starts to decline no lower than 60–70% of the worst-case transient peak to avoid excessive ripple and loop instability. Validate with short-pulse and steady-state sweeps and include margin for temperature-dependent derating and manufacturing variability.
Which in-field signals best indicate degrading inductor performance?
Monitor output ripple amplitude, periodic thermal excursions near the inductor, and occasional scope captures of the switch node. Rising ripple or step changes in temperature under identical load profiles are early indicators of increased DCR or partial saturation and should trigger targeted bench retest.