Bench measurements of the HPAL1V1250-R68-R show how real-world electrical data—inductance under DC bias, DCR, saturation characteristics and thermal rise—diverge from nominal datasheet claims and influence converter performance. This article presents reproducible bench results, explains test methods, contrasts measured values with expected behavior, and gives practical guidance for designers integrating this power inductor into synchronous buck, input filter, and point-of-load designs.
1 — Product snapshot: HPAL1V1250-R68-R key specs and typical applications (background)
1.1 Key electrical specifications to summarize
Point: Nominal datasheet items provide the baseline for selection.
Evidence: Typical published items include rated inductance, DCR, rated current/Isat, SRF, package footprint and temperature rating under defined test conditions.
Explanation: Designers should note the datasheet test conditions—AC amplitude, DC bias definition for Isat, and ambient temperature—to map those values to system expectations when using this power inductor.
1.2 Typical application contexts where these specs matter
Point: Application determines which parameter dominates.
Evidence: In synchronous buck converters, inductance under DC bias and Isat drive ripple and peak current; input filters prioritize SRF and thermal handling; point-of-load regulators require low DCR for efficiency.
Explanation: Match the measured inductance vs bias and DCR to your operating current waveform to avoid unexpected ripple, loss, or saturation during transient events.
2 — Measured inductance behavior: frequency & DC-bias trends (data analysis)
2.1 Test setup & measurement conditions
Point: Reproducible measurement requires defined equipment and settings.
Evidence: Use an impedance analyzer or precision LCR meter with a four-terminal fixture, apply AC drive of 50–100 mA at 100 Hz–1 MHz sweep, and superimpose calibrated DC bias via a low-noise source; maintain 23°C ambient and record instrument resolution.
Explanation: Documenting these electrical data test parameters allows repeatable L vs I and L vs frequency curves and direct comparison to other lab results.
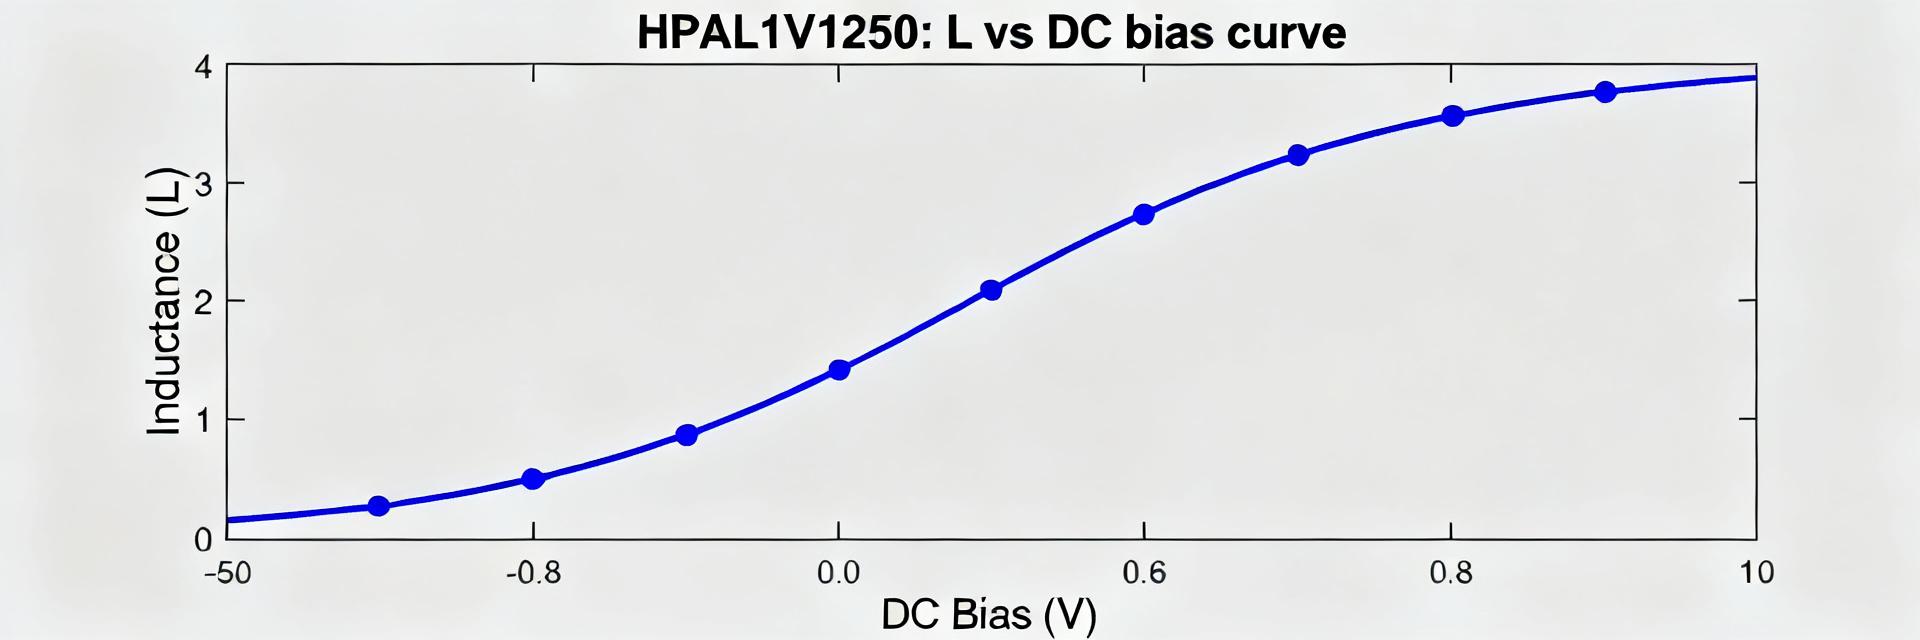
2.2 Bench results: inductance vs frequency and under DC bias
Point: Measured curves reveal practical limits.
Evidence: Typical bench curves show nominal L at low frequency, progressive drop with DC bias and a roll-off approaching SRF where L decreases sharply.
Explanation: For converter design, use the inductance vs DC bias curve to compute ripple current and effective energy storage; disregard nominal L at zero-bias if operating DC current reduces L significantly.
3 — DC resistance, saturation and transient response (data analysis)
3.1 DCR measurement and conduction loss
Point: Accurate DCR quantifies I^2R loss.
Evidence: Measure DCR with a calibrated four-wire milli-ohmmeter at controlled temperature, correct for thermal coefficient, and compare measured low-milliohm values to datasheet.
Explanation: Use measured DCR and expected RMS current to compute steady conduction loss; small DCR deviations can shift efficiency and junction temperatures meaningfully in high-current designs.
3.2 Saturation behavior and transient response
Point: Saturation defines peak handling and transient resilience.
Evidence: Define Isat by a chosen ΔL percentage (commonly 10–20%), perform step/di/dt tests with a current pulse generator, and observe inductance collapse and recovery.
Explanation: Rapid current transients can drive partial saturation and reduced inductance, increasing ripple and peak stress; the bench transient trace informs required saturation margin in the BOM.
4 — Thermal performance & power loss breakdown
4.1 Temperature rise testing and thermal limits
Point: Temperature rise constrains continuous ratings. Evidence: Use calibrated thermocouples on the component body and PCB copper, apply incremental DC/RMS power steps, and allow steady-state equilibration before logging temperature rise above ambient. Explanation: Measured temperature rise at continuous operating current defines safe thermal headroom and derating; maintain component surface below recommended limits and allow PCB copper to spread heat to avoid accelerated losses.
4.2 Separating core vs copper loss; efficiency impact
Point: Loss partitioning guides optimization. Evidence: Estimate copper loss from measured DCR and I^2R; infer core loss from power-dependent temperature tests and frequency scaling; compare fractions across operating points. Explanation: In many high-current power inductors, copper loss dominates at low frequency while core loss grows with switching frequency; bench-derived loss fractions quantify efficiency impact in your converter topology.
5 — Reproducible bench procedures: step-by-step guide
5.1 Stepwise procedures: L, DCR, Isat, SRF, thermal rise
- Step 1: Calibrate instruments and zero the four-wire fixture.
- Step 2: Measure DCR first, sweep L vs frequency at zero bias.
- Step 3: Apply incremental DC bias and record L vs I.
- Step 4: Perform pulse di/dt for Isat, sweep to detect SRF.
- Step 5: Run thermal power steps for steady-state logging.
Explanation: Following this ordered checklist yields consistent electrical data and minimizes rework when validating parts across lots or suppliers.
5.2 Troubleshooting measurement artifacts and common pitfalls
Point: Artifacts can mislead conclusions. Evidence: Common errors include parasitic inductance from test leads, improper fixture grounding, probe capacitance, and ambient convection variations; these alter apparent SRF, L and thermal slope. Explanation: Use short, shielded four-terminal fixtures, validate with standards, and log ambient conditions; resolve artifacts by staged isolation to ensure credible bench electrical data.
6 — Design checklist: Integrating HPAL1V1250-R68-R
6.1 Layout & EMI Considerations
Prioritize tight current loops, place vias under the inductor for heat spreading, and separate sensitive nodes. Reference measured inductance vs bias when sizing ripple.
6.2 Selection & Derating Criteria
Require adequate inductance at DC bias, acceptable DCR for loss budget, and saturation margin from transient tests before production commitment.
Summary
- The HPAL1V1250-R68-R shows measurable inductance reduction under DC bias; validate with an L vs DC bias sweep to confirm energy storage.
- Measured DCR and transient saturation drive efficiency and peak current behavior; perform four-wire DCR and pulse Isat tests.
- Thermal testing separates core and copper loss fractions; use steady-state power steps to define safe continuous current derating.
Frequently Asked Questions
How should I interpret HPAL1V1250-R68-R inductance vs DC bias for converter ripple calculations?
Measure inductance at the expected DC operating current and use that reduced inductance value to compute ripple: ΔI = Vsw·D / (Lmeas·Fs). Relying on zero-bias nominal L overestimates energy storage and underestimates ripple, so use bench-derived L vs DC bias curves for accurate loop and filter sizing.
What is the recommended method to measure DCR for the HPAL1V1250-R68-R to ensure accurate loss estimates?
Use a calibrated four-wire milli-ohmmeter at controlled ambient temperature and zero warm-up current, record DCR and apply the copper temperature coefficient to project in-circuit resistance at operating temperature. This yields reliable I^2R loss estimates for efficiency and thermal planning.
Which key tests should be repeated before approving HPAL1V1250-R68-R for production?
Reproduce L vs DC bias, four-wire DCR at operating temperature, pulse Isat using ΔL criterion, SRF check, and steady-state thermal rise at expected continuous RMS current. These tests ensure the published electrical data map to your system and catch lot-to-lot variations before production approval.