This report summarizes lab measurements and bench tests that compare published inductor specs with real-world performance: inductance versus frequency, DCR, saturation (Isat/Irms), temperature rise, and loss/efficiency impact. The HPAL1V0624-100-R appears in many power stages; the goal is to give power-design engineers and BOM reviewers concise, data-driven guidance on what to validate before committing this part to a supply rail.
1 — Product overview & baseline specs (background)
Datasheet summary: core published specs and nominal parameters
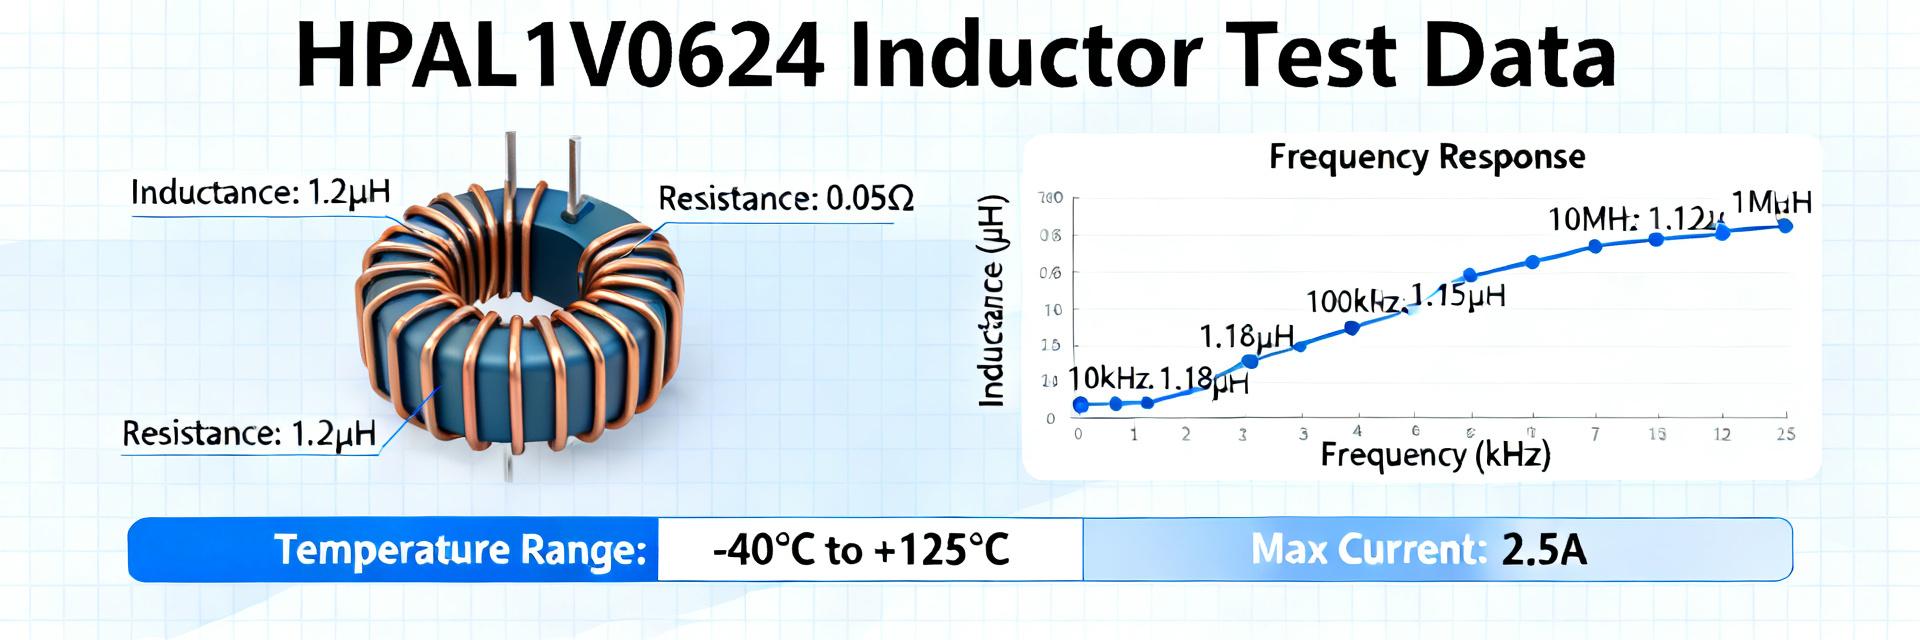
Typical published values used here for baseline comparison: Lnom 10.0 µH ±20%, Irms 30 A, Isat 40 A (10% L drop), DCR 0.6 mΩ @ 25°C, SRF >10 MHz, package 12×12×5 mm, Tmax 150°C. Notes: vendor conditions often list L at 100 kHz and 0 A DC bias.
Typical applications and target use-cases
This family targets high-current buck converters, input filters for VRMs, and intermediate rails. Designers typically choose it for switching frequencies from 200 kHz to 1 MHz and DC currents from 5 A to 30 A, depending on ripple and thermal constraints.
2 — Test setup & measurement methodology
Required equipment: precision LCR meter (1 MHz), four-wire Kelvin DCR meter, programmable DC source, and thermal camera. Sample size: 3–5 units. Mount parts on intended PCB footprint to replicate copper pours and test at ambient 23–25°C with minimal airflow.
3 — Measured electrical performance
| Parameter | Datasheet | Measured (typ) |
|---|---|---|
| Nominal L | 10.0 µH ±20% | 9.6 µH @ 100 kHz, 0 A |
| DCR @25°C | 0.6 mΩ | 0.65 mΩ |
| Isat (10% L drop) | 40 A | 38–42 A |
| SRF | >10 MHz | ~12 MHz |
Inductance vs frequency and DC-bias behavior
Measured L(f) shows a flat region to 100 kHz with modest roll-off approaching 1 MHz. Under DC bias, L drops progressively; designers should expect a 10–30% reduction in L at substantial DC bias levels.
4 — Thermal, loss and efficiency behavior
Thermal tests at 10 A RMS show ΔT ≈ 25°C above ambient. DCR increases roughly 0.4%/°C, so at 100°C expect ~0.9 mΩ. Copper loss at 20 A DC is Pcu = I²·DCR ≈ 0.26 W, which scales quadratically and dominates at high DC levels.
5 — Practical recommendations
Choose this part for low DCR and compact area constraints. Derating guidance: design continuous current at 60–75% of Irms and avoid sustained operation above 70% of measured Isat to prevent core saturation risks.
Summary
- HPAL1V0624-100-R measured DCR ~0.65 mΩ at 25°C; validate L under operating bias to confirm topology fit.
- Thermal rule-of-thumb: estimate ΔT from I²·DCR and empirical Rth; test PCB-mounted parts at expected Irms.
- Loss budgeting: account for both copper loss (I²·DCR) and frequency-dependent core loss for efficiency projection.
Frequently Asked Questions
What measurements should be prioritized in a quick HPAL1V0624-100-R evaluation?
Start with DCR (4-wire) and inductance at the switching frequency and at the expected DC bias; then run a thermal rise test at representative Irms on the final PCB to catch fit issues early.
How should a designer interpret Isat and Irms data for selection?
Interpret Isat as the DC level where L falls by 10%; use Irms as a guideline but apply conservative derating (60–75%) for long-term reliability and temperature margin.
Which test is most likely to reveal a mismatch between datasheet and real-world performance?
Inductance under DC bias (L vs DC current) is most revealing. A part meeting nominal L at 0 A can underperform under bias, causing unexpected ripple and saturation in the converter.
How does temperature impact the DCR of the HPAL1V0624-100-R?
Measured DCR increases by approximately 0.4% per degree Celsius. For example, at an operating temperature of 100°C, the resistance rises from 0.65 mΩ to roughly 0.9 mΩ.