Measured/tested figures show the AMELH6060S-4R7MT at 4.7 µH with a DCR on the order of 10.1 mΩ and high current capability (single-digit to mid‑teens amps depending on rating), tested at 100 kHz — making it a compact choice for high‑current power stages. This concise snapshot frames the part as a performance‑oriented SMD power inductor for point‑of‑load converters.
The article delivers clear electrical specs, interpretation of ratings, thermal and derating guidance, plus layout and selection checklists. Readers will get practical calculations (I²R loss, Vdrop), test‑condition notes to request from the datasheet, and a pre‑qualification checklist suitable for engineering sign‑off.
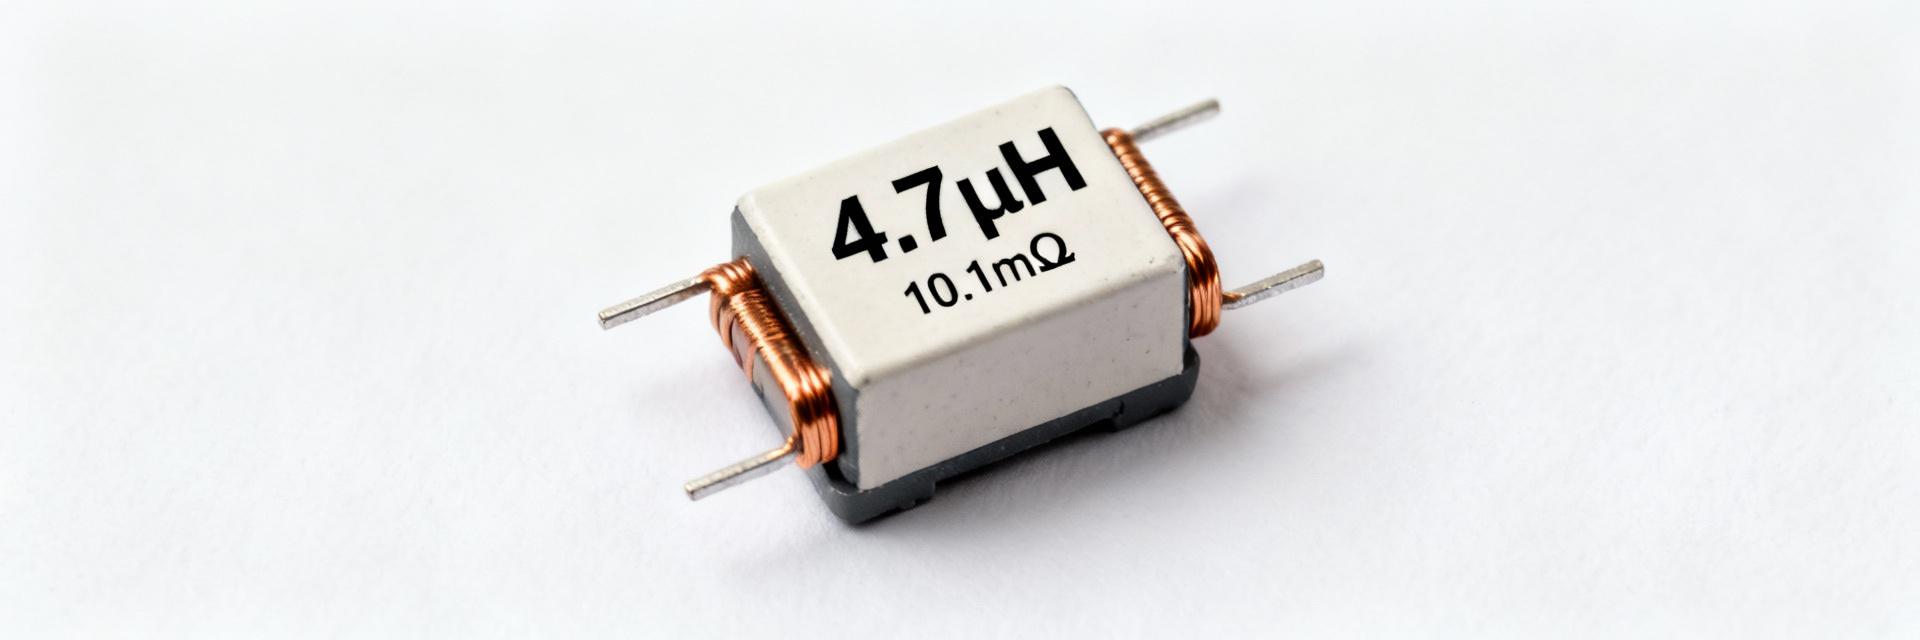
Product Overview & Mechanical Specs
Key Electrical Specs and Ratings at a Glance
Point: Provide a quick reference of core electrical specs to speed design decisions. Evidence: Typical vendor test parameters place inductance at 4.7 µH, measured at 100 kHz, with a DCR ≈ 10.1 mΩ and saturation current (Isat) roughly 13.5 A; Irms often listed near 10 A. Explanation: These electrical specs and ratings help balance loss, ripple current handling, and thermal budget when selecting an inductor for a switching stage.
| Parameter | Value (typ./max) | Visual Benchmarking |
|---|---|---|
| Inductance | 4.7 µH |
|
| Test Frequency | 100 kHz | Standard Power Test |
| DCR (max) | ≈ 10.1 mΩ |
|
| Isat (typ.) | ≈ 13.5 A |
|
| Irms (rated) | ≈ 10 A |
|
| Tolerance Code | M (±20%) | Standard Tolerance |
| SRF | See Datasheet | Frequency Dependent |
Package, Footprint and Mechanical Details
Point: Mechanical fit and thermal coupling are as important as electrical specs. Evidence: The series code implies a ~6.0 × 6.0 mm footprint, 2‑lead SMD, shielded/molded construction with low profile. Explanation: Confirm exact dimensions, pad layout and reflow profile from the official datasheet before PCB layout; use recommended land pattern and verify component height for enclosure clearance.
Electrical Performance Deep-dive & Data Analysis
DCR, Saturation, and Power Loss
Point: DCR and saturation current determine steady‑state loss and peak handling. Evidence: With DCR = 10.1 mΩ, at 10 A the copper loss P = I²·DCR ≈ 1.01 W and voltage drop V = I·DCR ≈ 0.101 V. Explanation: That 1 W of dissipation requires PCB thermal paths or derating; call out vendor measurement conditions since DCR and Isat are temperature‑dependent.
Frequency Response & SRF
Point: Inductance is frequency‑dependent and only usable below SRF. Evidence: The nominal inductance is quoted at 100 kHz, a switching frequency relevant for many buck converters. Explanation: Include an impedance vs. frequency curve in validation; ensure SRF is well above the converter’s switching fundamental and dominant harmonics for reliable inductive behavior.
Thermal Behavior, Derating and Reliability
Estimating Temperature Rise
Point: Translate calculated losses into temperature rise to establish safe current. Evidence: Using the earlier P ≈ 1.01 W example, multiply by the effective PCB/component thermal resistance (°C/W) to estimate ∆T above ambient. Explanation: Apply safety margins—select Isat/Irms at least 25–40% above expected steady current, and validate with thermal imaging and in‑system current sweeps.
Reliability Factors & Range
Point: Long‑term reliability depends on temperature cycling, materials and solder quality. Evidence: Typical power inductors specify operating ranges around −40°C to +125°C. Explanation: Request vendor qualification data (thermal‑rise curves, solder reflow limits, IEC/JEDEC test reports) for high‑reliability applications and confirm any derating required.
Selection, PCB Layout and Application Checklist
Cross-checks, Substitutes and Qualification Steps
Datasheet Verification
- •Verify DCR measurement method.
- •Confirm Isat definition/test current.
- •Check rated/temperature curves & SRF.
- •Verify mechanical tolerances & reflow limits.
Comparing Substitutes
Point: Prioritize the parameters that affect performance and loss. Evidence: Compare candidates by inductance at operating frequency, DCR and its impact on I²R loss, Isat/Irms, and footprint. Explanation: Accept trade‑offs when justified (e.g., slightly higher DCR for significantly higher Isat) but re‑calculate losses.