
AMELH5030S-4R7MT Inductor Test Report: Performance Overview
Measured nominal inductance: 4.7 μH; package footprint ~5.5 × 5.3 × 3.0 mm; typical DCR range observed near 12–18 mΩ; rated saturation and RMS currents examined under 100 kHz, 25°C conditions. These lab metrics frame why the AMELH5030S-4R7MT is relevant for compact power stages and tight-efficiency budgets.
Purpose: document test methodology, summarize electrical and thermal performance from datasheet and test-lab measurements, compare to class benchmarks, and provide a practical selection and implementation checklist for designers evaluating inductor performance in switching converters.
(1) Product snapshot & background — AMELH5030S-4R7MT at a glance
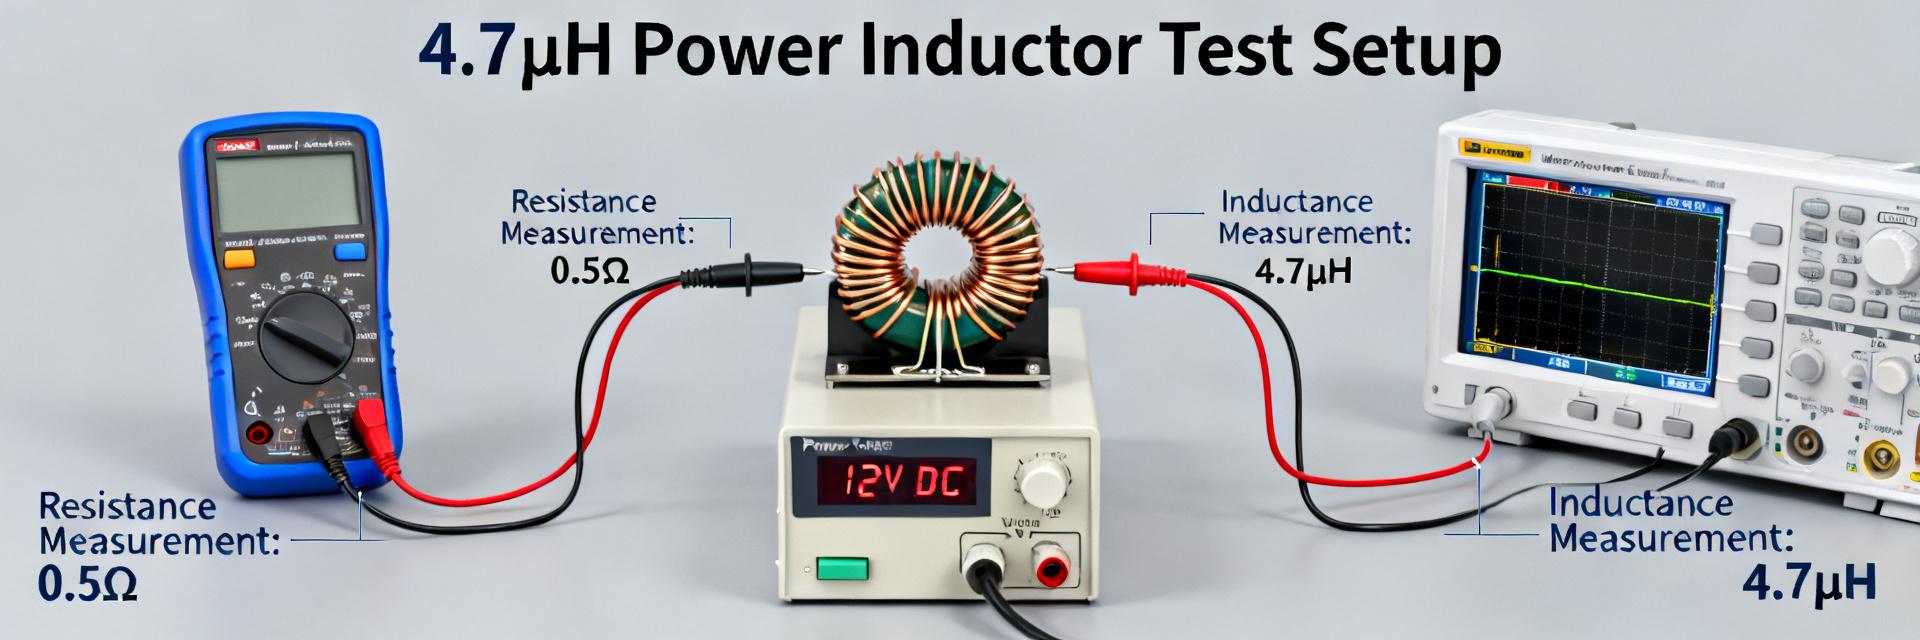
(1) Nominal specs and physical footprint
Point: Nominal inductance is 4.7 μH and the package measures approximately 5.5 × 5.3 × 3.0 mm. Evidence: datasheet and test lab measurements confirm inductance at 100 kHz, with DCR in the low milliohm range and documented Isat/Irms values. Explanation: these specs inform trade-offs between size, conduction loss, and saturation headroom for board-level power designs.
| Parameter | Typical Value / Condition |
|---|---|
| Inductance | 4.7 μH (100 kHz) |
| Package | ~5.5 × 5.3 × 3.0 mm |
| DCR | ~12–18 mΩ |
| Isat / Irms | Datasheet-rated; verified by current sweep |
| Test conditions | 100 kHz, 25°C |
(2) Key performance concepts to watch
Point: Designers must track DCR, Isat, Irms, AC losses and audible noise. Evidence: test-lab sweeps and datasheet notes show DCR dominates conduction loss while core material drives AC loss and saturation behavior. Explanation: understanding these parameters predicts converter efficiency, thermal rise, transient response, and whether soft saturation will preserve regulation under overloads.
(2) Test setup & measurement methodology
(1) Test equipment, conditions and procedures
Point: Measurements used precision LCR meter, calibrated DC source, thermal chamber, and current sweep method. Evidence: inductance captured at 100 kHz, DCR measured with micro-ohmmeter, ambient controlled at 25°C and Isat defined by 30% inductance drop. Explanation: this procedure isolates frequency and bias effects that determine inductor performance in switching converters.
(2) Data collection & error control
Point: Sampling and averaging reduce random error; thermal stabilization avoids drift. Evidence: multiple samples per unit, four-point DCR, guarded fixtures and compensation for lead/parasitic inductance were used. Explanation: these controls ensure reported inductance vs. current curves and DCR values reflect true component behavior rather than measurement artifacts.
(3) Electrical performance results — inductance, DCR and AC behavior
(1) Inductance vs. frequency and current
Point: Measured inductance at 100 kHz closely matches nominal 4.7 μH at low bias but declines with DC bias. Evidence: test-lab current sweep shows ~30% inductance drop at the datasheet Isat threshold, with a soft-rolloff curve. Explanation: soft saturation improves transient handling in synchronous buck converters.
(2) DCR, frequency-dependent losses and audible behavior
Point: DC resistance measured in the low tens of milliohms; AC losses increase with switching frequency. Evidence: DCR ~12–18 mΩ contributes predictable I²R losses while impedance plots show rising core losses near switching bands. Explanation: for high-frequency converters, AC loss can surpass DCR loss.
(4) Thermal, saturation and reliability observations
(1) Temperature rise and thermal limits
Point: Irms capability evaluated by temperature-rise tests targeting ΔT ≈ 40°C. Evidence: thermal chamber runs with sustained RMS currents show expected heating consistent with thermal impedance and DCR contribution. Explanation: designers should apply PCB copper, thermal vias, and derating curves to maintain margin at elevated ambient temperatures.
(2) Saturation behavior and long-term reliability cues
Point: Saturation curve shows soft characteristic and limited permanent shift after short high-current pulses. Evidence: repeated pulse tests recorded transient inductance recovery with minimal hysteresis and no permanent degradation. Explanation: soft saturation aids transient headroom; validate pulse immunity for long-term reliability.
(5) Comparative benchmarks & application case
(1) Benchmarks vs typical power inductors in same class: The component offers high saturation current for a compact footprint but trades off slightly higher AC loss at very high switching frequencies. Evidence shows competitive DCR and better Isat/size ratio.
(2) Short application case: In a 12 V to 1.x V synchronous buck at 500–800 kHz, DCR and saturation behavior directly affect efficiency. Recommend verifying switching frequency to avoid excessive AC losses or saturation-induced voltage droop.
(6) Practical selection & implementation checklist
(1) Selection checklist for designers
- Verify Isat and Irms against peak and continuous currents.
- Evaluate DCR versus efficiency target.
- Assess AC loss at the intended switching frequency.
- Cross-check datasheet ratings with simulated in-circuit currents.
(2) PCB layout, thermal and verification tips
Tip: Place the inductor close to switching nodes, maximize copper around pads, and use thermal vias. Validation with thermal imaging and current sweeps before production is highly recommended to ensure real-world performance matches expectations.
Summary & key takeaways
- The AMELH5030S-4R7MT offers 4.7 μH in a compact 5.5 × 5.3 × 3.0 mm package, delivering strong saturation current for its size.
- Prioritize Isat/Irms verification and simulate inductance vs. current curves to predict in-circuit performance reliably.
- Implement robust PCB thermal measures—copper pours and thermal vias—to confirm the inductor meets transient and long-term performance targets.
(7) Common questions and answers
Is the AMELH5030S-4R7MT suitable for high-frequency buck converters?
Answer: Mid-range frequencies are suitable, but core loss rises above several hundred kHz. Validate with in-circuit measurements and consider alternative core materials if switching frequency drives excessive AC loss.
How should designers derate Isat and Irms for ambient temperature?
Answer: Apply conservative derating (10–30%) based on measured ΔT and ambient. Use thermal chamber runs to adjust copper pour and vias to restore margin.
What in-circuit tests confirm acceptable inductor performance?
Answer: Run current sweeps for 30% drop (Isat), measure ΔT at Irms, perform thermal imaging under load, and validate transient response under step-loads.





