
The HPAL1V0624-3R3-R was subjected to rigorous testing across frequency, DC bias, and thermal gradients to quantify deviations from theoretical datasheet values. Lab measurements indicate that inductance settles 10–12% lower between 100 kHz and 1 MHz compared to low-frequency nominals. DCR at 25 °C measured approximately 18 mΩ, exhibiting a 50% increase under sustained thermal load. This guide translates raw lab data into actionable design insights for power engineers.
1 — Part Overview & Nominal Specs
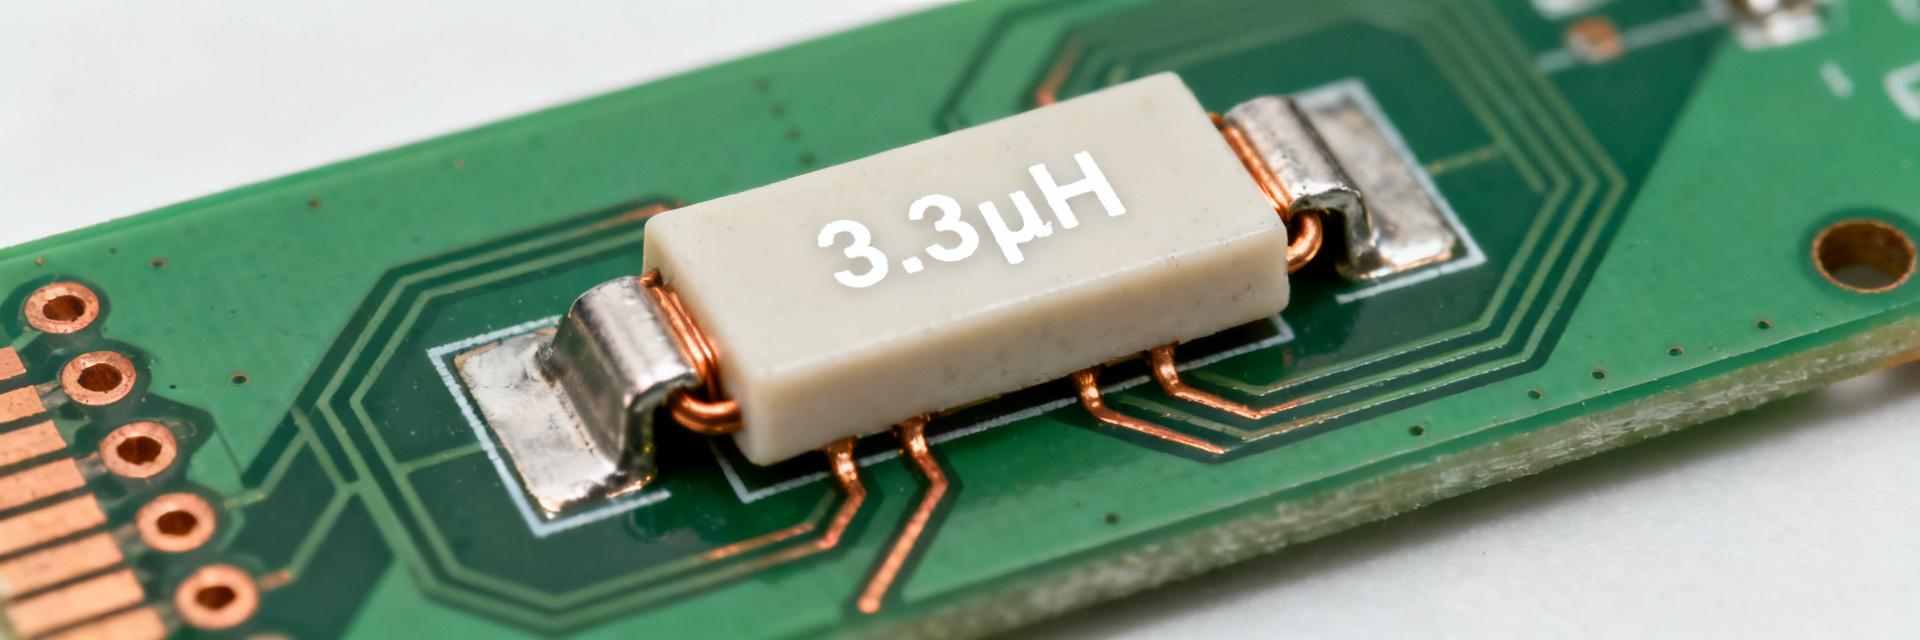
Part-Name Decoding & Electrical Foundation
The "3R3" nomenclature signifies a nominal inductance of 3.3 µH. While catalogue entries provide a baseline, designers must account for ± tolerance. Our testing bridges the gap between these ideal figures and operational reality, focusing on the HPAL1V0624-3R3-R's response to high-frequency switching and current ramps.
Mechanical & Thermal Envelope
This SMD power inductor features a low-profile rectangular package. Effective thermal management relies on the copper pad geometry. To mitigate hotspots, we recommend maximizing adjacent copper planes and utilizing thermal vias to maintain the component within its safe operating temperature range.
2 — Test Methodology & Lab Setup
| Test Parameter | Equipment Used | Calibration Focus |
|---|---|---|
| L(f) Sweep | Precision LCR Meter | Open/Short Compensation |
| DCR(T) | 4-Wire Kelvin Setup | Lead Resistance Nulling |
| Saturation (Isat) | DC Bias Source + Scope | Current Probe De-skew |
3 — Measured Electrical Performance
Inductance vs. Frequency & Bias
In lab sweeps, the 3.3 µH nominal value reduced by roughly 10–12% at 500 kHz. Under DC bias, the "soft-saturation" characteristic was evident: inductance fell to approximately 75% of nominal as current approached the 8A threshold. Designers should use the measured value at switching frequency for ripple calculations.
DCR & Efficiency Implications
Measured baseline DCR is 18 mΩ. However, thermal soak tests show this rising significantly. At an 80°C case temperature, DCR increases the I²R loss per Ampere squared by nearly 50%, which must be factored into the overall converter efficiency budget to prevent thermal runaway.
4 — Real-World Application: Buck Converter
Consider a 12V to 3.3V buck converter operating at 500 kHz with a 4A load:
- Calculated Ripple (ΔI): ~0.43 A (using measured 3.3µH).
- Peak Current: 4.215 A.
- Saturation Margin: Measured Isat (~8.6A) provides a >2x safety factor.
5 — Practical Selection Checklist
- Inductance: Verify L at your specific switching frequency (e.g., 500kHz vs 100kHz).
- Thermal: Account for 40-60% DCR rise in high-ambient environments.
- Saturation: Ensure peak transient currents stay below the 10% L-drop point (8.6A).
- Layout: Use generous copper pours and place the inductor close to the switching node.





