
Introduction — Point: Accurate component selection for power converters depends on clear interpretation of published specs and repeatable lab verification. Evidence: Manufacturer-published sheets and independent lab runs routinely report ~6.8 µH nominal inductance with measurable saturation and thermal constraints. Explanation: This article highlights which published specifications and measured test data most influence usable current, losses, and reliability when designing with this ferrite-core SMD power inductor.
Introduction — Point: Designers need compact spec tables, reproducible test conditions, and a short decision checklist. Evidence: Typical datasheets list L, Isat, Irms, DCR and SRF but often omit test set-up details. Explanation: The following sections provide a spec checklist, recommended test parameters, measurement procedures, and template tables to convert datasheet numbers into design confidence.
Background & key specifications for HCM1A0703V3-6R8-R
Electrical specification checklist (L, Isat, Irms, DCR, SRF)
| Parameter | Typical / Nominal | Test condition / Note |
|---|---|---|
| Inductance (L) | 6.8 µH | Measured at 100 kHz, 0.25 Vrms, +25°C |
| Tolerance | ±20% | Standard manufacturing tolerance |
| Isat | Defined as X% L-drop | Specify % drop (e.g., 20%) for consistency |
| Irms | Temp-rise based | Rated to ΔT (e.g., +40°C rise) |
| DCR | mΩ (typ) | Measured at +25°C for loss calc |
| SRF | MHz (typ) | Defines HF impedance roll-off |
Mechanical & material specs (package, core, temp rating)
- Package: 0703 SMD outline (~7.3 x 7.3 x 3.0 mm nominal).
- Core: Powdered iron or Ferrite material; determines saturation slope and loss behavior.
- Temperature Rating: Operating/Storage range; reflow peak and dwell recommendations per J-STD-020.
Test parameters & measurement setup
Standard test conditions to report
| Parameter | Recommended Value |
|---|---|
| Inductance frequency | 100 kHz |
| AC drive | 0.25 Vrms |
| DC bias sweep | 0 A → Isat (10–20 steps) |
| Ambient temp | +25°C (stabilized) |
Key test-data metrics: interpretation
Saturation behavior and DC-bias derating
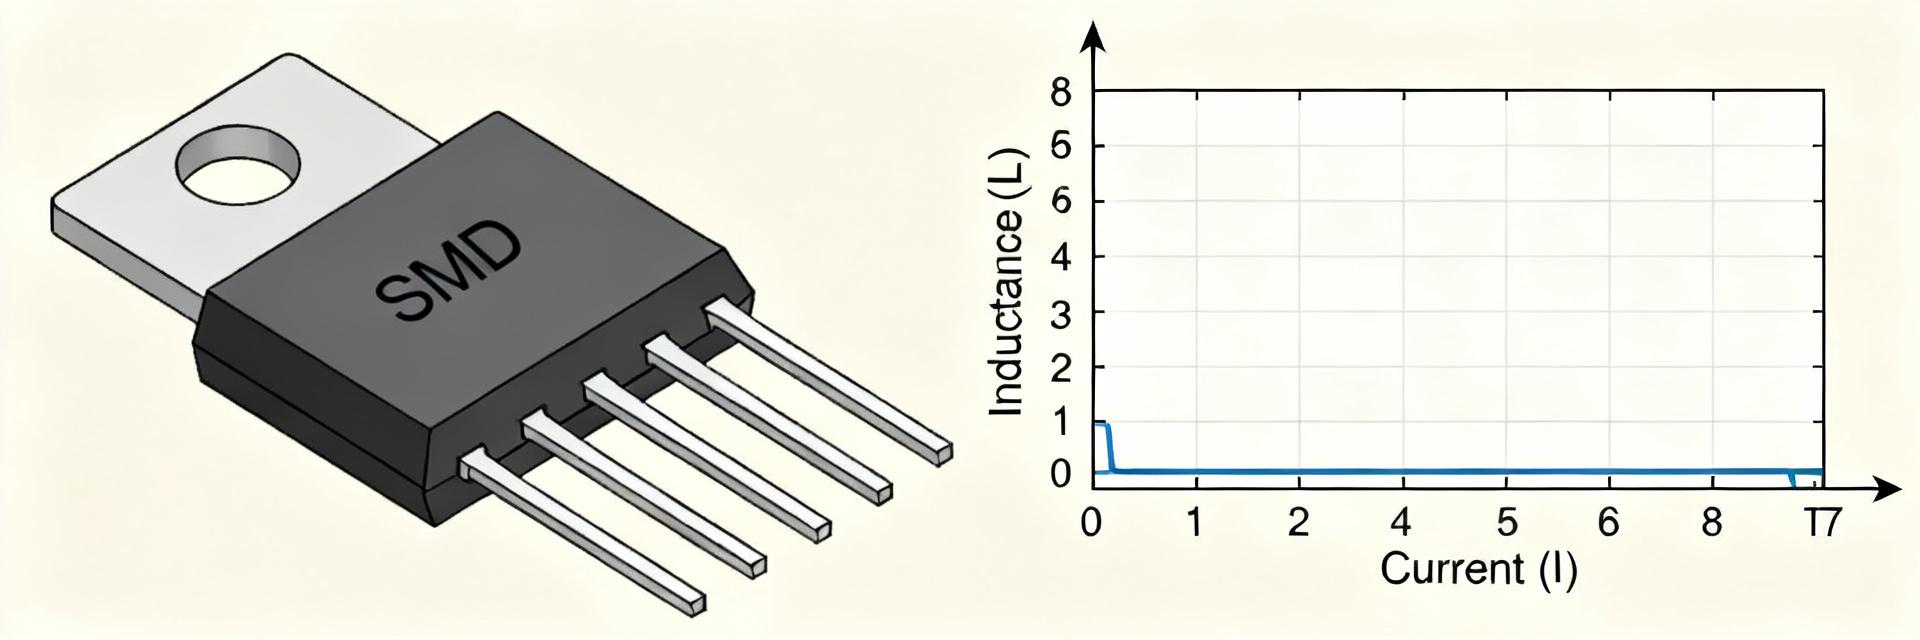
The L vs. IDC curve dictates usable inductance at operating current. If L drops >30% at peak operating current, either add margin or select a higher-Isat variant to preserve converter loop stability and ripple control.
Sample test-data summary
| Metric | Datasheet | Measured | Δ% |
|---|---|---|---|
| L (nominal) | 6.8 µH | 6.7 µH | -1.5% |
| Isat (10% L-drop) | 2.8 A (typ) | 2.6 A | -7% |
| DCR | 40 mΩ (typ) | 42 mΩ | +5% |
| Irms (ΔT=40°C) | 1.8 A (rated) | 1.6 A | -11% |





