
The HCM1A4020V3-6R8-R is specified as a nominal 6.8 µH molded, shielded SMD inductor with a rated current near 1.7 A and a maximum DCR on the order of 192 mΩ. These specs determine conduction losses, saturation margin, and usable frequency band for power filtering and DC–DC converter loops. This article presents focused specs, recommended test methods, and practical measurement targets so engineers can validate performance and decide whether this 6.8uH SMD inductor meets their design needs.
Overview & key specs (background)
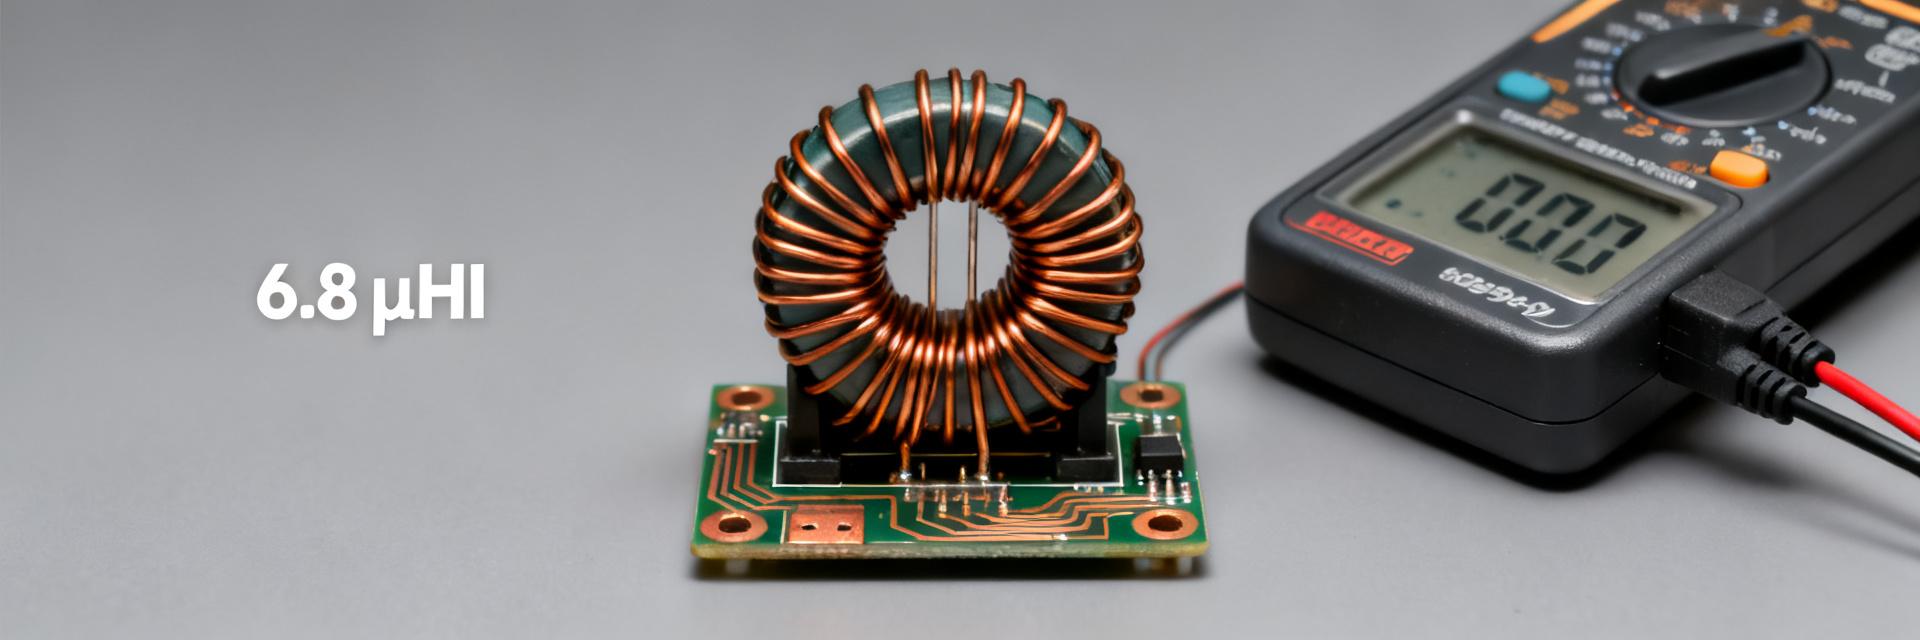
Quick spec summary for readers
| Parameter | Value / Notes |
|---|---|
| Nominal inductance | 6.8 µH |
| Tolerance | Refer to part labeling (typical ±20%) |
| Rated current | ~1.7 A (thermal rating) |
| Saturation current | Specified as Isat; design for margin |
| Maximum DCR | ~192 mΩ |
| Package | Shielded molded SMD |
| Self-resonant frequency (SRF) | Typically in low MHz range (check datasheet) |
| Operating temperature | Standard component range; verify for thermal derating |
Point: The block above highlights the critical specs engineers inspect first.
Evidence: Inductance, rated/saturation current, DCR, and SRF are the key levers for power applications.
Explanation: For switching regulators the inductance sets EMI/filter corner, DCR sets I²R loss and heating, and saturation defines usable DC bias before L collapses.
Interpreting the part number and variant notes
Point: The part code encodes family, size, and inductance. Evidence: HCM1A4020V3-6R8-R-style identifiers typically include series, footprint, and inductance value (6R8 = 6.8 µH). Explanation: When evaluating alternatives, confirm variant suffixes for tolerance, packaging (taped reel vs bulk), and any suffix that indicates higher current or lower DCR; these variations materially affect the published specs and real-world performance.
Electrical characteristics & datasheet highlights (data analysis)
Inductance, tolerance, and frequency dependence
Point: Datasheet L is measured at a particular test frequency (commonly 100 kHz or 1 MHz) and will fall with increasing frequency. Evidence: Typical L vs frequency curves show a steady decrease as core permeability drops and winding reactance dominates. Explanation: Always report measurement frequency and instrument settings; expect L within tolerance at the datasheet test frequency, and plan for 10–30% reduction at higher MHz frequencies depending on SRF.
DCR, rated current, saturation, and thermal behavior
Point: DCR sets steady-state I²R losses and contributes to thermal rise; saturation current defines when L collapses under DC bias. Evidence: A DCR near 192 mΩ at room temperature implies measurable losses at ampere-level currents, and saturation knee often occurs above the rated current. Explanation: Use four-wire DCR measurement and thermally derate the rated current for intended ambient and PCB thermal resistance; expect DCR to increase with temperature and adjust margins accordingly.
Test methods & measured test data (method guide)
Recommended lab setup & measurement procedures
Point: Accurate characterization needs the right instruments and fixtures. Evidence: Use an LCR meter for small-signal L at specified frequencies, a four-terminal milliohm meter for DCR, an impedance analyzer or VNA for L(f) and SRF, and a controlled current source with oscilloscope for saturation testing. Explanation: Calibrate fixtures, use short PCB traces or Kelvin clips, warm up instruments, record test frequency and amplitude, and document ambient temperature to ensure repeatable comparison to datasheet specs.
Typical test results and example plots to include
Point: Key plots show how the part behaves under realistic loads. Evidence: Include inductance vs frequency, impedance magnitude vs frequency, L vs DC bias current, DCR vs temperature, and a saturation curve showing L collapse. Explanation: Acceptance ranges: inductance within marked tolerance at test frequency, DCR within ±10–20% of datasheet max, L reduction proportional to DC bias with a clear saturation knee near Isat; use these ranges for go/no-go decisions.
Application scenarios & PCB/thermal considerations (case study)
Typical use cases: power filtering and DC–DC converters
Point: A 6.8 µH SMD inductor is often chosen for input/output filters and low-frequency converter loops. Evidence: Its inductance value and current rating balance energy storage and size for moderate-power buck or boost regulators. Explanation: Select this part when moderate inductance and compact shielded packaging are required; if low DCR is paramount for efficiency, compare alternatives with lower DCR and higher current rating to reduce losses.
PCB layout, mounting, and thermal management tips
Point: Layout and thermal paths directly affect current rating and reliability. Evidence: Short switching loops, minimal parasitic inductance, and copper pours/vias for heat spreading reduce thermal rise. Explanation: Place the inductor close to the regulator, use wide traces for high-current paths, add thermal vias under pads where allowed, and follow recommended solder profiles for molded parts to avoid mechanical stress and ensure solder fillet integrity.
Selection, qualification & production checklist (action guide)
How to choose this part vs alternatives
Point: Selection requires matching electrical, mechanical, and thermal requirements. Evidence: Compare required inductance, DC current, DCR, height limits, and cost to similar footprints. Explanation: Use a derating margin (20–30% below rated current), verify SRF for the switching frequency, and flag high DCR or low saturation as red flags during early bench tests.
Incoming inspection and go/no-go test checklist
Point: A concise QA flow reduces production risk. Evidence: Perform dimensional checks, sample L and DCR tests (4–6 items per lot), L vs DC bias verification, solderability and visual inspection, and ensure lot traceability. Explanation: Set pass criteria (L within tolerance at test frequency; DCR ≤ datasheet max +20%; no visible defects); if failures occur, quarantine batch and escalate to engineering for root-cause analysis.
Summary
- The HCM1A4020V3-6R8-R 6.8uH SMD inductor combines a 6.8 µH nominal value, ~1.7 A rated current, and ~192 mΩ max DCR; these specs determine suitability for filters and moderate-power DC–DC converters and must be verified in-system.
- Key measurements to run during qualification are inductance at the datasheet test frequency, DCR by four-wire method, L versus DC bias to locate saturation, and impedance/SRF to confirm usable frequency range.
- In layout and production, prioritize short current loops, robust copper for thermal dissipation, proper soldering profiles for molded packages, and an incoming inspection plan that includes electrical sampling and traceability.
FAQ
Does the HCM1A4020V3-6R8-R meet typical switching regulator needs?
Yes—provided the converter current stays below the derated rated current and DCR losses are acceptable. Verify L at converter switching frequency, confirm L vs DC bias behavior, and ensure thermal management keeps the part within its operating temperature to prevent performance degradation.
How should I measure DCR for the 6.8uH SMD inductor?
Use a four-terminal (Kelvin) milliohm meter or precision LCR with a DCR mode and fixture that minimizes lead resistance. Measure at stable ambient temperature and report values alongside ambient to compare to the datasheet max (allowing a tolerance window, e.g., +20%).
What acceptance criteria should I use for incoming inspection of this part?
Check dimensions and solderability visually, sample 4–6 units per lot for L and DCR. Accept if L is within stated tolerance at the datasheet frequency and DCR ≤ datasheet max +20%. If L vs DC bias shows excessive reduction or DCR drifts significantly with temperature, escalate to engineering for retest.
What are the consequences of exceeding the saturation current rating?
Exceeding Isat causes a sharp drop in inductance, leading to high ripple currents, magnetic saturation, loss of regulator efficiency, and potential damage to switching MOSFETs due to overcurrent.





